

Application of Logistic model combined with ROC curve and Bayes discriminant function in the diagnosis of severity of COVID-19
-
摘要:
目的 使用两种统计方法(Logistic模型联合ROC曲线法和Bayes判别函数法)对新型冠状病毒肺炎(简称新冠肺炎,corona virus disease 2019,COVID-19)患者严重程度进行预测,以期辅助临床对于患者分型早期诊断。 方法 收集538名确诊病例的人口学相关信息、临床资料及流行病学调查资料等,计数资料使用例数(%)表示,采用Logistic回归分析模型进行单因素和多因素回归分析;采用ROC曲线法找到最佳临界值;采用Bayes判别法对研究对象进行分类。 结果 Logistic模型联合ROC曲线法的总体预测准确率分别为0.682,重症预测正确率为0.784,轻症预测正确率为0.662;Bayes判别法总体预测准确率分别为0.703,重症预测正确率为0.705,轻症预测正确率为0.702。 结论 Logistic模型联合ROC曲线法与Bayes判别分析在鉴别COVID-19临床严重程度诊断中均有较高的正确率,且各有优势,两种方法均有一定的应用价值。 -
关键词:
- 新型冠状病毒肺炎 /
- 临床严重程度 /
- Logistic回归分析模型 /
- ROC曲线 /
- Bayes函数
Abstract:Objective corona virus disease 2019(COVID-19) patients were predicted by two statistical methods (Logistic model combined with ROC curve and Bayes discriminant function), in order to assist the clinical classification of patients for early diagnosis. Methods Demography related information, clinical data and epidemiological investigation data of 538 confirmed cases was collected. Number of cases (%) was used to describe categorical data. Logistic model is used for single factor and multi factor regression analysis; ROC curve method is used to find the optimum critical point; Bayes discriminant method is used to classify the subjects. Results The overall prediction accuracy of the Logistic combined ROC curve method was 0.682, the prediction accuracy of severe symptoms cases was 0.784, and that of mild symptoms cases was 0.662. The overall prediction accuracy of Bayes discriminant method was 0.703, the prediction accuracy of severe symptoms cases was 0.705, and that of mild symptoms cases was 0.702. Conclusions Logistic regression analysis model combined ROC curve method and Bayes discriminant analysis both have high accuracy in the diagnosis of clinical severity of COVID-19, and each has its own advantages. Both of them have certain application value. -
Key words:
- COVID-19 /
- Clinical severity /
- Logistic regression analysis model /
- ROC curve /
- Bayes function
-

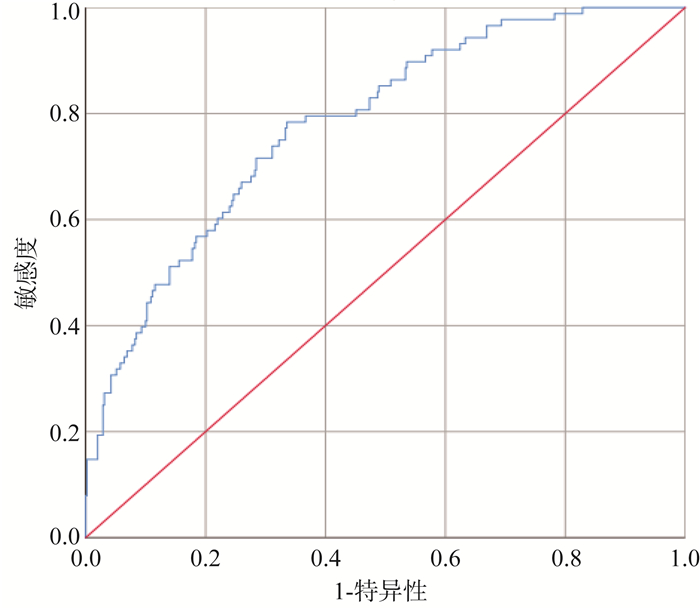
图 1 多因素Logistic模型预测概率值的ROC曲线
Figure 1. The ROC curve of probability value predicted by multivariate Logistic model
表 1 变量赋值
Table 1. Variable assignment
指标 赋值 严重程度 1=重症,0=轻症 性别 1=男,2=女 年龄(岁) 连续型变量 发病到确诊时间(d) 连续型变量 病例来源 1=输入病例,2=本地病例 是否为无症状感染者 1=是,0=否 患基础性疾病 1=有,0=无 是否有相关临床症状 1=是,0=否 临床症状数量 连续型变量 注:相关临床症状包括:发热、咳嗽、肺炎、流鼻水、喉咙痛、腹泻等消化道症状、肌肉/关节酸痛、头痛/头晕、乏力、胸闷、畏寒/寒颤、咳痰。  下载: 导出CSV
表 2 以临床严重程度为因变量构建的单因素和多因素Logistic回归分析模型
Table 2. Univariate and multivariate Logistic models constructed with clinical severity as the dependent variable
变量 单因素分析 多因素分析 OR(95% CI)值 P值 OR(95% CI)值 P值 是否为无症状感染者 否 1.000 1.000 是 0.310 (0.109~0.875) 0.027 0.695 (0.199~2.423) 0.568 是否伴基础性疾病 否 1.000 1.000 是 3.231 (2.023~5.160) < 0.001 1.983 (1.165~3.374) 0.012 是否有发热症状 否 1.000 1.000 是 1.817 (1.126~2.930) 0.014 1.462 (0.775~2.757) 0.241 是否有咳嗽症状 否 1.000 1.000 是 2.068 (1.302~3.283) 0.002 1.51 (0.825~2.764) 0.182 是否有肺炎症状 否 1.000 1.000 是 1.662 (1.030~2.680) 0.037 1.091 (0.607~1.962) 0.770 年龄(岁) 1.060 (1.043~1.078) < 0.001 1.062 (1.042~1.083) < 0.001 发病到确诊时间(d) 1.066 (1.019~1.115) 0.005 1.042 (0.988~1.098) 0.130 临床症状数量 1.332 (1.154~1.538) < 0.001 1.240(0.976~1.577) 0.078
下载: 导出CSV
表 3 单因素Bayes判别分析
Table 3. Single factor Bayes discriminant analysis
变量 Wilk's λ值 P值 年龄 0.898 < 0.001 发病到确诊时间 0.985 0.004 是否为无症状感染者 0.990 0.020 伴基础性疾病 0.971 < 0.001 是否有发热症状 0.989 0.013 是否有咳嗽症状 0.982 0.002 是否有肺炎症状 0.992 0.036 临床症状数量 0.970 < 0.001
下载: 导出CSV
表 4 多因素Bayes判别函数系数
Table 4. Multivariate Bayes discriminant function coefficient
变量 临床症状 Wilk's λ值 P值 年龄 6.51 6.367 发病到确诊时间 0.289 -0.508 是否为无症状感染者 2.02 1.672 是否伴基础性疾病 1.006 0.593 是否有发热症状 0.526 0.480 是否有咳嗽症状 0.238 0.185 是否有肺炎症状 0.181 0.149 临床症状数量 1.488 1.276 常量 -11.667 -7.531
下载: 导出CSV
表 5 两种预测方法预测准确度比较[n(%)]
Table 5. Comparison of prediction accuracy between the two prediction methods [n(%)]
预测结果 重症 轻症 P值 Logistic联合ROC曲线法 < 0.001 重症 69(78.4) 152(33.8) 轻症 19(21.6) 298(66.2) Bayes判别法 < 0.001 重症 62(70.5) 134(29.8) 轻症 26(29.5) 316(70.2)
下载: 导出CSV
-
[1] The 2019-nCoV Outbreak Joint Field Epidemiology Investigation Team, Li Q. Notes from the field:an outbreak of NCIP (2019-nCoV) infection in China - Wuhan, Hubei Province, 2019 2020[J]. China CDC Weekly, 2020, 2(5):79-80. DOI: 10.46234/ccdcw2020.022. [2] World Health Organization. Naming the coronavirus disease (COVID-19) and the virus that causes it[EB/OL]. (2020-02-11)[2020-03-05].https://www.who.int/emergencies/diseases/novel-coronavirus-2019/technical-guidance/naming-the-coronavirus-disease-(covid-2019)-and-the-virus-that-causes-it. [3] 四川省卫生健康委员会.截至3月1日24时新型冠状病毒肺炎疫情最新情况[EB/OL]. (2020-03-02)[2020-03-05]. http://wsjkw.sc.gov.cn/scwsjkw/gzbd01/2020/3/2/6538a65ef064454396b019ed5149eaa0.shtml.Sichuan Provincial Health Commission. The latesst epidemic situation of coVID-19 as of 24: 00 March 1[EB/OL]. (2020-03-02)[2020-03-05]. http://wsjkw.sc.gov.cn/scwsjkw/gzbd01/2020/3/2/6538a65ef064454396b019ed5149eaa0.shtml. [4] 中华人民共和国卫生健康委员会.新型冠状病毒感染的肺炎诊疗方案(试行第六版)[A/OL].国卫办医涵[2020]103号, (2020-02-19)[2020-03-05].http://www.nhc.gov.cn/yzygj/s7652m/202002/54e1ad5c2aac45c19eb541799bf637e9.shtmlCommission of health, PRC. Novel coronavirus pneumonia diagnosis and treatment scheme (trial sixth edition)[A/OL]. State health office medical treatment no.103, 2020-02-19)[2020-02-28]. http://www.nhc.gov.cn/yzygj/s7652m/202002/54e1ad5c2aac45c19eb541799bf637e9.shtml [5] 万崇华.高级医学统计学[M].北京:科学出版社, 2014:138-145.Wan CH. Advanced medical statistics[M]. Beijing:Science Press, 2014:138-145. [6] Wu YC, Chen CS. The outbreak of COVID-19:an overview[J]. Journal of the Chinese Medical Association:JCMA, 2020, 83(3):217-220. DOI: 10.1097/JCMA.0000000000000270. [7] 中国疾病预防控制中心新型冠状病毒肺炎应急响应机制流行病学组.新型冠状病毒肺炎流行病学特征分析[J].中华流行病学杂志, 2020, 41(2):145-151. DOI: 10.3760/cma.j.issn.0254-6450.2020.02.003.Epidemiology Working Group for NCIP Epidemic Response.The epidemiological characteristics of an outbreak of 2019 novel coronavirus diseases (COVID-19) in China[J]. Chin J Epidemiol, 2020, 41(2):145-151. DOI: 10.3760/cma.j.issn.0254-6450.2020.02.003. [8] 陈晨, 陈琛, 严江涛, 等.新型冠状病毒肺炎危重症患者心肌损伤及患有心血管基础疾病的情况分析[J/OL].中华心血管病杂志, 2020, 48. DOI: 10.3760/cma.j.cn112148-20200225-00123.Chen C, Chen C, Yan JT, et al. Analysis of myocardial injury in patients with COVID-19 and association between concomitant cardiovascular diseases and severity of COVID-19[J/OL]. Chin J Cardiol, 2020, 48. DOI: 10.3760/cma.j.cn112148-20200225-00123. [9] Wang D, Hu B, Hu C, et al. Clinical characteristics of 138 hospitalized patients with 2019 novel coronavirus-infected pneumonia in Wuhan, China[J]. JAMA, 2020, 323(11):1061-1069. DOI: 10.1001/jama.2020.1585. [10] Zheng YY, Ma YT, Zhang JY. COVID-19 and the cardiovascular system[J]. Nat Rev Cardiol, 2020;17(5):259-260. DOI: 10.1038/s41569-020-0360-5. [11] Kaoru T, Hachiro U, Shinichiro Y, et al. The logistic regression and ROC analysis of group-based screening for predicting diabetes incidence in four years[J]. Kobe J Med Sci, 2006, 52(6):171-80. [12] 桂林, 杨建波, 黄远帅, 等. Logistic回归和Fisher线性判别分析模型在卵巢肿瘤良恶性鉴别诊断中的价值[J].重庆医学, 2018, 47(6):800-802. DOI:10.3969/j.issn.1671-8348.2018.06.025.Gui L, Yang JB, Huang YS, et al. Logistic regression and Fisher linear discriminant analysis model in benign and malignant ovarian tumors in the differential diagnosis value[J]. Chongqing Med J, 2018, 47(6):800-802. DOI: 10.3969/j.iSSN.1671-8348.2018.06.025. [13] 伍柳玉, 兰景尤, 黄丹丹.基于产检信息的Bayes判别分析在巨大儿发生风险中的初步探讨[J].中华疾病控制杂志, 2019, 23(11): 1338-1341, 1347. DOI: 10.16462/j.cnki.zhjbkz.2019.11.008.Preliminary study on the risk of macrosomia using Bayesian discriminant analysis based on prenatal records[J]. Chin J Dis Control Prev, 2019, 23(11): 1338-1341, 1347. DOI: 10.16462/j.cnki.zhjbkz.2019.11.008. -

 点击查看大图
计量
- 文章访问数: 552
- HTML全文浏览量: 227
- PDF下载量: 68
- 被引次数: 0