

Association between exposure to air pollution and the risk of hypertension: a cohort study based on UK Biobank
-
摘要:
目的 研究NO2、NOx、PM10、PM2.5和PM2.5-10等空气污染物与高血压发病风险的关系,为预防高血压提供参考。 方法 基于英国生物银行(UK Biobank,UKB)数据库构建随访队列,采用Cox风险比例回归模型进行关联分析,分别研究空气污染物年平均浓度和空气污染物日累积暴露量与高血压发病风险的关联。此外,本研究还创建了空气污染物的累积暴露加权评分以评估几种空气污染物联合暴露与高血压发病风险的关系。 结果 Cox比例风险回归模型结果显示,只有NOx的年平均浓度可以增加高血压发病风险。NO2、NOx、PM10、PM2.5和PM2.5-10日累积暴露量每增长50 μg/m3·day,HRs(95% CI)值分别为1.06(1.04~1.08)、1.03(1.02~1.04)、1.11(1.07~1.14)、1.18(1.12~1.24)和1.26(1.17~1.37)。空气污染物的累积暴露加权评分与高血压风险呈正向的剂量-反应关系(P < 0.001)。 结论 长期暴露于包括PM2.5、PM10、PM2.5-10、NO2和NOx在内的空气污染物中,无论是暴露于单一污染物还是多种污染物,都与高血压发病风险增加相关。本研究强调了全面评估各种空气污染物对于预防高血压的重要性。 Abstract:Objective To study the relationship between air pollutants, such as NO2, NOx, PM10, PM2.5 and PM2.5-10, and the risk of hypertension, and to provide a reference for the prevention of hypertension. Methods We constructed follow-up cohorts on the basis of UK Biobank (UKB) and used Cox proportional-hazards regression models for association analyses. We separately studied the associations of annual mean concentrations of air pollutants and cumulative daily exposures to air pollutants with the risk of hypertension. In addition, a cumulative exposure weighted score for air pollutants was created to assess the association between combined exposure to several air pollutants and the risk of hypertension. Results Cox proportional risk model results showed that only the annual mean concentration of NOx increased the risk of hypertension when using the annual mean concentration of air pollutants as exposure. The HRs (95% CI) of hypertension for a 50 μg/m3·day increase in daily cumulative exposure to NO2, NOx, PM10, PM2.5 and PM2.5-10 were 1.06 (1.04-1.08), 1.03 (1.02-1.04), 1.11 (1.07-1.14), 1.18 (1.12-1.24) and 1.26 (1.17-1.37), respectively. There was a positive dose-response relationship between the cumulative exposure weighted score of air pollutants and the risk of hypertension (P < 0.001). Conclusions Our findings suggest that long-term exposure to various air pollutants including PM2.5, PM10, PM2.5-10, NO2 and NOx, either individually or jointly, were associated with an increased risk of hypertension significantly. Our study highlights the importance of a comprehensive assessment of various air pollutants in hypertension prevention. -
Key words:
- Air pollution /
- Hypertension /
- Joint exposure /
- Cohort study
-

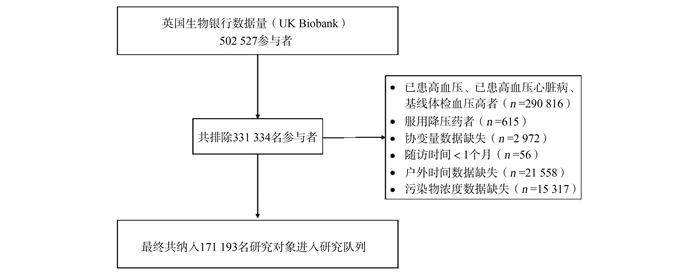
图 1 研究对象纳入排除流程图
Figure 1. The flowchart of enrollment of participants in the present study
表 1 研究对象的基线特征[n(%)]
Table 1. Baseline characteristics of the participants included in this study [n(%)]
基线特征 高血压事件 P值 否(n=163 406) 是(n=7 787) 年龄(x±s, 岁) 53.55±8.02 59.49±7.33 < 0.001 男性 62 413(38.20) 4 234(54.44) < 0.001 BMI(x±s, kg/m2) 25.88±4.05 28.23±4.82 < 0.001 SBP(x±s, mm Hg) 123.71±10.03 126.52±9.71 < 0.001 DBP(x±s, mm Hg) 75.30±7.27 75.71±7.79 < 0.001 Townsend剥夺指数 -1.42±2.99 -0.85±3.27 < 0.001 吸烟状况 < 0.001 从不 94 349(57.74) 3 284(42.17) 以前 50 724(31.04) 3 276(42.08) 现在 18 333(11.22) 1 227(15.76) 饮酒状况 < 0.001 从不 6 343(3.88) 481(6.18) 以前 5 383(3.29) 431(5.53) 现在 151 680(92.82) 6 875(88.29) 白人 147 412(90.21) 7 045(90.47) 0.464 糖尿病 677(0.41) 388(4.98) 0.001 健康饮食评分 2.77±0.90 2.81±0.86 < 0.001 NO2(x±s, μg/m3) 26.71±7.74 27.24±7.76 < 0.001 NOx(x±s, μg/m3) 43.98±15.66 45.34±16.54 < 0.001 PM10(x±s, μg/m3) 16.22±1.90 16.29±1.87 0.001 PM2.5(x±s, μg/m3) 9.99±1.07 10.09±1.10 < 0.001 PM2.5-10(x±s, μg/m3) 6.42±0.89 6.44±0.89 0.139 空气污染物日累积暴露量 NO2(x±s, μg/m3·day) 72.10±55.26 87.10±63.36 < 0.001 NOx(x±s, μg/m3·day) 118.94±96.88 145.12±113.49 < 0.001 PM10(x±s, μg/m3·day) 43.92±30.51 52.26±34.05 < 0.001 PM2.5(x±s, μg/m3·day) 27.06±18.77 32.33±20.96 < 0.001 PM2.5-10(x±s, μg/m3·day) 17.42±12.28 20.68±13.69 < 0.001  下载: 导出CSV
表 2 空气污染物浓度与高血压发病风险的关联
Table 2. Association of air pollutant concentrations with the risk of hypertension
变量 空气污染物浓度(五分位数) HR (95% CI)值每增长10μg/m3 P值 Q1 Q2
HR (95% CI)值Q3
HR (95% CI)值Q4
HR (95% CI)值Q5
HR (95% CI)值NO2 1 1.10(1.02~1.19) 1.15(1.07~1.24) 1.11(1.03~1.20) 1.04(0.95~1.12) 1.02(0.99~1.05) 0.246 NOx 1 1.10(1.03~1.19) 1.21(1.13~1.30) 1.12(1.04~1.21) 1.06(0.98~1.15) 1.02(1.00~1.03) 0.037 PM10 1 1.03(0.96~1.10) 1.05(0.98~1.13) 1.01(0.94~1.08) 1.01(0.94~1.09) 1.05(0.93~1.18) 0.422 PM2.5 1 1.08(1.01~1.17) 1.18(1.10~1.27) 1.12(1.04~1.21) 1.06(0.98~1.15) 1.24(0.99~1.55) 0.067 PM2.5-10 1 1.02(0.95~1.09) 1.11(1.03~1.19) 1.02(0.95~1.10) 1.02(0.95~1.09) 0.99(0.77~1.27) 0.935
下载: 导出CSV
表 3 空气污染物日累积暴露量与高血压发病风险的关联
Table 3. Association between daily cumulative exposure to air pollutants and the risk of hypertension
变量 空气污染物日累积暴露(五分位数) HR (95% CI)值每增长50μg/m3 P值 Q1 Q2
HR (95% CI)值Q3
HR (95% CI)值Q4
HR (95% CI)值Q5
HR (95% CI)值NO2 1 1.02(0.93~1.10) 1.13(1.05~1.23) 1.16(1.07~1.25) 1.26(1.17~1.36) 1.06(1.04~1.08) < 0.001 NOx 1 1.06(0.98~1.15) 1.16(1.07~1.25) 1.19(1.10~1.29) 1.27(1.18~1.37) 1.03(1.02~1.04) < 0.001 PM10 1 1.00(0.92~1.08) 1.05(0.97~1.14) 1.15(1.07~1.24) 1.23(1.14~1.32) 1.11(1.07~1.14) < 0.001 PM2.5 1 1.02(0.94~1.11) 1.09(1.01~1.18) 1.18(1.09~1.27) 1.25(1.16~1.35) 1.18(1.12~1.24) < 0.001 PM2.5-10 1 1.02(0.94~1.11) 1.09(1.01~1.18) 1.17(1.09~1.26) 1.23(1.14~1.32) 1.26(1.17~1.37) < 0.001
下载: 导出CSV
表 4 空气污染暴露评分与高血压发病风险的关联
Table 4. Association between air pollution exposure score and the risk of hypertension
模型 空气污染暴露评分(五分位数) HR (95% CI)值每增长一个标准差 P值 Q1 Q2
HR (95% CI)值Q3
HR (95% CI)值Q4
HR (95% CI)值Q5
HR (95% CI)值模型1 a 1 1.12(1.03~1.21) 1.41(1.30~1.52) 1.74(1.62~1.88) 2.23(2.08~2.40) 1.24(1.21~1.26) < 0.001 模型2 b 1 1.01(0.93~1.09) 1.15(1.06~1.25) 1.27(1.18~1.37) 1.49(1.38~1.61) 1.15(1.13~1.17) < 0.001 模型3 c 1 1.01(0.93~1.10) 1.11(1.02~1.20) 1.17(1.09~1.27) 1.24(1.15~1.34) 1.06(1.04~1.09) < 0.001 注:a未调整模型;b调整性别、年龄;c调整年龄、性别、BMI、Townsend剥夺指数、健康饮食评分、SBP、DBP、糖尿病、吸烟、饮酒。
下载: 导出CSV
-
[1] Zhou B, Perel P, Mensah GA, et al. Global epidemiology, health burden and effective interventions for elevated blood pressure and hypertension[J]. Nat Rev Cardiol, 2021, 18(11): 785-802. DOI: 10.1038/s41569-021-00559-8. [2] Gbd 2019 Risk Factors Collaborators. Global burden of 87 risk factors in 204 countries and territories, 1990-2019: a systematic analysis for the Global Burden of Disease Study 2019[J]. Lancet, 2020, 396(10258): 1223-1249. DOI: 10.1016/S0140-6736(20)30752-2. [3] 李娜. 颗粒物和NO2长期暴露与血压关系及PM2.5短期暴露对血压急性效应的研究[D]. 武汉: 武汉大学, 2020.LI Na, Associations of long-term exposure to particulate matter and NO2 with blood pressure, and acute effects of exposure to PM2.5 on blood pressure[D]. Wuhan: Wuhan university, 2020. [4] 张文韬, 张进娜, 顾唯佳, 等. 细颗粒物长期暴露对高血压影响的荟萃分析与系统评价[J]. 中华高血压杂志, 2021, 29(10): 947-952. DOI: 10.16439/j.issn.1673-7245.2021.10.010.Zhang WT, Zhang JN, Gu WJ, et al. The effect of long-term exposure to fine particulate matter on hypertension: a meta-analysis and system review[J]. Chin J Hypertension, 2021, 29(10): 947-952. DOI: 10.16439/j.issn.1673-7245.2021.10.010. [5] 石琴, 郑山, 朱文芝, 等. NO2对高血压患者血压和脉压的短期影响[J]. 中国环境科学, 2020, 40(8): 3627-3635. DOI: 10.19674/j.cnki.issn1000-6923.2020.0405.Shi Q, Zheng S, Zhu WZ, et al. The short-term effects of NO2 on blood pressure and pulse pressure in patients with hypertension[J]. China Environmental Science, 2020, 40(8): 3627-3635. DOI: 10.19674/j.cnki.issn1000-6923.2020.0405. [6] Babisch W, Wolf K, Petz M, et al. Associations between traffic noise, particulate air pollution, hypertension, and isolated systolic hypertension in adults: the KORA study[J]. Environmental Health Perspectives, 2014, 122(5): 492-498. DOI: 10.1289/ehp.1306981. [7] 李海平. 大气主要污染物及其与人群健康的关系[J]. 江苏预防医学, 2020, 31(6): 635-636, 647. DOI: 10.13668/j.issn.1006-9070.2020.06.012.LI HP. Major air pollutants and their relationship with human health[J]. Jiangsu Journal of Preventive Medicine, 2020, 31(6): 635-636, 647. DOI: 10.13668/j.issn.1006-9070.2020.06.012. [8] Sudlow C, Gallacher J, Allen N, et al. UK Biobank: An open access resource for identifying the causes of a wide range of complex diseases of middle and old age[J]. PLoS Med, 2015, 12(3): e1001779. DOI: 10.1371/journal.pmed.1001779. [9] Li ZH, Zhong WF, Liu S, et al. Associations of habitual fish oil supplementation with cardiovascular outcomes and all cause mortality: evidence from a large population based cohort study[J]. BMJ, 2020, 368: m456. DOI: 10.1136/bmj.m456. [10] Wang M, Zhou T, Song Y, et al. Joint exposure to various ambient air pollutants and incident heart failure: a prospective analysis in UK Biobank[J]. Eur Heart J, 2021, 42(16): 1582-1591. DOI: 10.1093/eurheartj/ehaa1031. [11] Bycroft C, Freeman C, Petkova D, et al. The UK Biobank resource with deep phenotyping and genomic data[J]. Nature, 2018, 562(7726): 203-209. DOI: 10.1038/s41586-018-0579-z. [12] Cakmak S, Dales R, Kauri LM, et al. Metal composition of fine particulate air pollution and acute changes in cardiorespiratory physiology[J]. Environmental Pollut, 2014, 189: 208-214. DOI: 10.1016/j.envpol.2014.03.004. [13] Chen R, Yin P, Meng X, et al. Associations Between Ambient Nitrogen Dioxide and Daily Cause-specific Mortality: Evidence from 272 Chinese Cities[J]. Epidemiology, 2018, 29(4): 482-489. DOI: 10.1097/EDE.0000000000000829. [14] Bai L, Chen H, Hatzopoulou M, et al. Exposure to Ambient Ultrafine Particles and Nitro-gen Dioxide and Incident Hypertension and Diabetes[J]. Epidemiology, 2018, 29(3): 323-332. DOI: 10.1097/EDE.0000000000000798. [15] Song J, Lu M, Lu J, et al. Acute effect of ambient air pollution on hospitalization in patients with hypertension: A time-series study in Shijiazhuang, China[J]. Ecotox Environ Safe, 2019, 170: 286-292. DOI: 10.1016/j.ecoenv.2018.11.125. [16] Chiu HF, Tsai SS, Yang CY. Short-term effects of fine particulate air pollution on hospital admissions for hypertension: A time-stratified case-crossover study in Taipei[J]. J Toxicol Env Heal A, 2017, 80(5): 258-265. DOI: 10.1080/15287394.2017.1321095. [17] Münzel T, Sørensen M, Gori T, et al. Environmental stressors and cardio-metabolic disease: part Ⅱ-mechanistic insights[J]. Eur Heart J, 2017, 38(8): 557-564. DOI: 10.1093/eurheartj/ehw294. [18] Münzel T, Sørensen M, Gori T, et al. Environmental stressors and cardio-metabolic disease: part Ⅰ-epidemiologic evidence supporting a role for noise and air pollution and effects of mitigation strategies[J]. Eur Heart J, 2017, 38(8): 550-556. DOI: 10.1093/eurheartj/ehw269. -

 点击查看大图
计量
- 文章访问数: 620
- HTML全文浏览量: 464
- PDF下载量: 126
- 被引次数: 0