

Dose-response association between lipid profiles and serum urate acid in Chinese adults
-
摘要:
目的 探讨中国成人血脂成分与血尿酸(serum uric acid, SUA)间的剂量-反应关系,为高尿酸血症(hyperuricemia, HUA)的防治提供理论依据。 方法 基于中国健康与营养调查(China Health and Nutrition Survey, CHNS) 2009年和中国健康与养老追踪调查(China Health and Retirement Longitudinal Study, CHARLS) 2011-2012年的调查数据,分别纳入符合研究纳入排除标准的研究对象8 509名和6 749名。采用广义倾向性评分逆概率加权方法,均衡年龄、性别等潜在混杂因素后,估计血脂成分总胆固醇(cholesterol, TC)、低密度脂蛋白(low-density lipoprotein, LDL)、高密度脂蛋白(high-density lipoprotein, HDL)和三酰甘油(triglycerides, TG)与SUA间的剂量-反应关系。 结果 CHNS和CHARLS研究对象的平均年龄分别为(50.32±15.08)岁和(58.52±9.17)岁,SUA升高者分别占15.30%和5.34%。在均衡可能的混杂因素后,逆概率加权法分析结果显示,TG和HDL与SUA间存在统计学剂量-反应关系,SUA水平随TG水平的升高和HDL水平的降低而升高。 结论 血脂异常可能导致SUA升高,及时调节血脂水平可能有助于HUA的防治。 -
关键词:
- 血脂成分 /
- 血尿酸 /
- 高尿酸血症 /
- 剂量-反应关系 /
- 广义倾向性评分逆概率加权法
Abstract:Objective This study aims to estimate dose-response relationship of lipid profiles on serum urate acid (SUA), and to provide evidence for prevention and therapy of Hyperuricemia (HUA). Methods Based on China Health and Nutrition Survey (CHNS) in 2009 and China Health and Retirement Longitudinal Study (CHARLS) in 2011-2012, 8 509 and 6 749 participants with no missing key variables were included in this study, respectively. Generalized propensity score based inverse probability weighting (IPW) method was used to adjust for potential confounders, and to estimate dose-response curves of total cholesterol (TC), low-density lipoprotein (LDL), high-density lipoprotein (HDL), and triglycerides (TG) on SUA. Results In CHNS, the mean age was (50.32±15.08) years old with 15.3% of individuals having high levels of SUA. In CHARLS, the mean age was (58.52±9.17) years old and, 5.34% of individuals had high levels of SUA. Results of IPW analysis showed that there were statistically significant dose-response relationship between TG, HDL and SUA in both CHNS and CHARLS. The SUA increased as TG increased and HDL decreased. Conclusions The abnormality of lipid profiles may lead to an increase in SUA, and the timely lipid-modifying may help to prevent and treat HUA. -

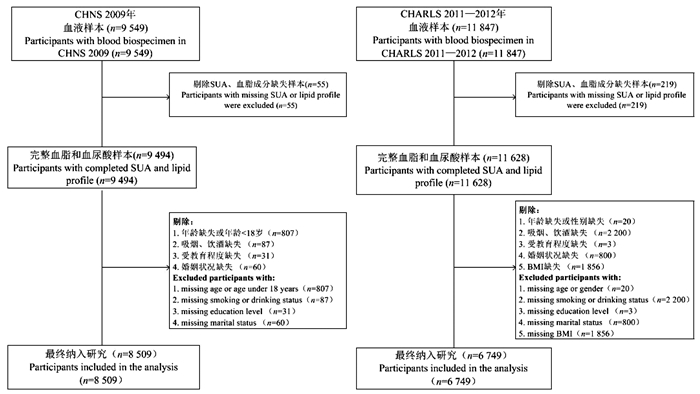
图 1 CHNS和CHARLS数据集研究对象筛选流程图
CHNS, 中国健康与营养调查; CHARLS, 中国健康与养老追踪调查。
Figure 1. Flow chart of subject screening for CHNS and CHARLS datasets
CHNS, China Health and Nutrition Survey; CHARLS, China Health and Retirement Longitudinal Study.

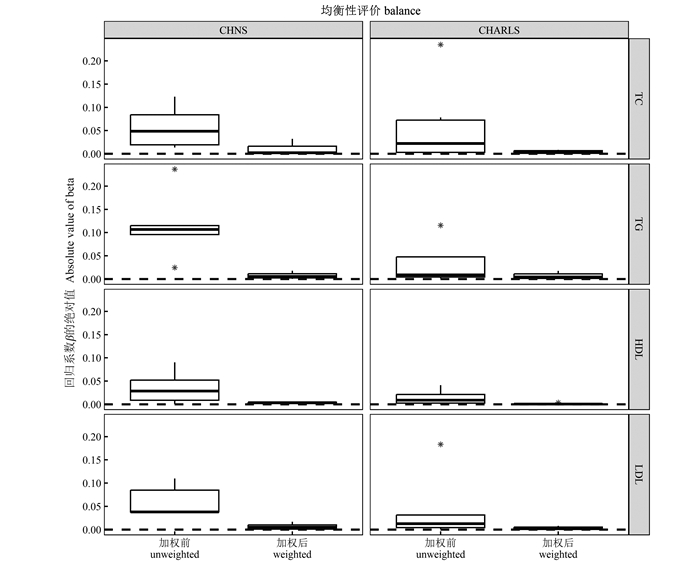
图 2 加权前后样本中协变量均衡性表现
CHNS, 中国健康与营养调查; CHARLS, 中国健康与养老追踪调查; SUA, 血尿酸; TC, 总胆固醇; TG, 三酰甘油; LDL, 低密度脂蛋白; HDL, 高密度脂蛋白。
图中星号表示离群点。Figure 2. Performance of covariate balance in a sample before and after weighting
CHNS, China Health and Nutrition Survey; CHARLS, China Health and Retirement Longitudinal Study; TC, cholesterol; TG, triglycerides; LDL, low-density lipoprotein; HDL, high-density lipoprotein.
The asterisks in the figure indicate outliers.表 1 研究对象基线特征
Table 1. Baseline characteristics of the study subjects
变量
Variables变量赋值
Value assignmentCHNS CHARLS SUA正常①
Normal SUA levels①
(n=7 209)SUA升高①
High SUA levels①
(n=1 300)P值
valueSUA正常①
Normal SUA levels①
(n=6 403)SUA升高①
High SUA levels①
(n=346)P值
value年龄组/岁Age group/years 49.82±15.02 53.06±15.14 < 0.001 58.36±9.12 61.38±9.71 < 0.001 18~<45 2 684(37.2) 384(29.5) < 0.001 173(2.7) 7(2.0) < 0.001 45~<60 2 600(36.1) 471(36.2) 3 670(57.3) 155(44.8) ≥60 1 925(26.7) 445(34.3) 2 560(40.0) 184(53.2) 性别Gender < 0.001 < 0.001 男Male 1 3 149(43.7) 797(61.3) 3 021(47.2) 208(60.1) 女Female 2 4 060(56.3) 503(38.7) 3 382(52.8) 138(39.9) 婚姻状况Marital status 0.321 0.157 离婚/丧偶/分居/未婚Divorced/Widowed/Separated/Never married 0 1 127(15.6) 218(16.8) 3 610(56.4) 209(60.4) 已婚/同居Married/Live with partners 1 6 082(84.4) 1 082(83.2) 2 793(43.6) 137(39.6) 受教育程度Education 0.141 0.609 小学及以下Primary school or lower 0 3 145(43.6) 538(41.4) 4 387(68.5) 232(67.1) 初中及以上Middle school or higher 1 4 064(56.4) 762(58.6) 2 016(31.5) 114(32.9) 吸烟Smoking < 0.001 0.742 从不吸烟Never 0 5 101(70.8) 808(62.2) 4 596(71.8) 253(73.1) 已戒烟Quit 1 224(3.1) 55(4.2) 455(7.1) 21(6.1) 现在仍吸Currently 2 1 884(26.1) 437(33.6) 1 352(21.1) 72(20.8) 饮酒Drinking < 0.001 0.013 从不饮酒Never 0 5 026(69.7) 742(57.1) 5 207(81.3) 273(78.9) 每月少于1次Less than once a month 1 312(4.3) 57(4.4) 650(10.2) 51(14.7) 每月多于1次More than once a month 2 1 871(26.0) 501(38.5) 546(8.5) 22(6.4) TG/(mmol·L-1) 1.43±1.00 3.01±2.55 < 0.001 1.43±1.03 2.12±1.71 < 0.001 HDL/(mmol·L-1) 1.47±0.47 1.28±0.59 < 0.001 1.33±0.40 1.20±0.42 < 0.001 LDL/(mmol·L-1) 2.98±0.94 2.99±1.21 0.659 3.01±0.89 3.03±1.10 0.661 TC/(mmol·L-1) 4.79±0.97 5.27±1.11 < 0.001 5.00±0.98 5.30±1.17 < 0.001 BMI/(kg·m-2) 23.67±4.01 23.74±3.62 0.751 < 18.5 448(7.0) 12(3.5) 0.065 18.5~ < 24.0 3 177(49.6) 186(53.8) 24.0~ < 28.0 1 959(30.6) 106(30.6) ≥28.0 819(12.8) 42(12.1) 注:CHNS, 中国健康与营养调查; CHARLS, 中国健康与养老追踪调查; SUA, 血尿酸; TC, 总胆固醇; LDL, 低密度脂蛋白; HDL, 高密度脂蛋白; TG, 三酰甘油。
①以[人数(占比/%)]或(x±s)表示。
Notes: CHNS, China Health and Nutrition Survey; CHARLS, China Health and Retirement Longitudinal Study; SUA, serum urate acid; TC, cholesterol; LDL, low-density lipoprotein; HDL, high-density lipoprotein; TG, triglycerides.
① [Number of people (proportion/%)]or (x±s). 下载: 导出CSV
表 2 SUA与血脂成分间剂量-反应关系分析结果
Table 2. Analysis results of dose-response relationship between SUA and blood lipid components
数据集Datasets 单变量模型Univariate models β sx t值value P值value CHNS TC 35.84 18.57 1.93 0.054 TG 33.67 5.49 6.13 < 0.001 HDL -30.58 7.10 -4.31 < 0.001 LDL -0.706 1.85 -0.38 0.702 CHARLS TC 10.06 0.97 10.41 < 0.001 TG 13.31 1.17 11.42 < 0.001 HDL -16.34 2.46 -6.65 < 0.001 LDL 4.68 1.10 4.24 < 0.001 注:CHNS, 中国健康与营养调查; CHARLS, 中国健康与养老追踪调查; SUA, 血尿酸; TC, 总胆固醇; TG, 三酰甘油; LDL, 低密度脂蛋白; HDL, 高密度脂蛋白。
上述单变量模型指各血脂成分与SUA间的加权单变量线性回归模型,权重由非参数的协变量均衡广义倾向性评分方法估计
Notes: CHNS, China Health and Nutrition Survey; CHARLS, China Health and Retirement Longitudinal Study; TC, cholesterol; TG, triglycerides; LDL, low-density lipoprotein; HDL, high-density lipoprotein.
The above univariate model refers to the weighted univariate linear regression model between each lipid component and SUA, the weight of which is estimated by the non-parametric covariate balancing generalized propensity score method.
下载: 导出CSV
-
[1] Jalal DI, Chonchol M, Chen W, et al. Uric acid as a target of therapy in CKD [J]. Am J Kidney Dis, 2013, 61(1): 134-146. DOI: 10.1053/j.ajkd.2012.07.021. [2] Choi HK, Ford ES. Prevalence of the metabolic syndrome in individuals with hyperuricemia [J]. Am J Med, 2007, 120(5): 442-447. DOI: 10.1016/j.amjmed.2006.06.040. [3] Forman JP, Choi H, Curhan G C. Plasma uric acid level and risk for incident hypertension among men [J]. J Am Soc Nephrol, 2007, 18(1): 287-292. DOI: 10.1681/ASN.2006080865. [4] Zhang M, Zhu XX, Wu J, et al. Prevalence of hyperuricemia among Chinese adults: findings from two nationally representative cross-sectional surveys in 2015—16 and 2018—19[J]. Front Immunol, 2021, 12: 791983. DOI: 10.3389/fimmu.2021.791983. [5] Peng LQ, Jing JR, He SM, et al. The role of lipid traits in mediating the effect of body mass index on serum urate [J]. Fron Endocrinol (Lausanne), 2022, 13: 938891. DOI: 10.3389/fendo.2022.938891. [6] Dalbeth N, Allan J, Gamble GD, et al. Effect of body mass index on serum urate and renal uric acid handling responses to an oral inosine load: experimental intervention study in healthy volunteers [J]. Arthritis Res Ther, 2020, 22(1): 259. DOI: 10.1186/s13075-020-02357-y. [7] Tsushima Y, Nishizawa H, Tochino Y, et al. Uric acid secretion from adipose tissue and its increase in obesity [J]. J Biol Chem, 2013, 288(38): 27138-27149. DOI: 10.1074/jbc.M113.485094. [8] Hou YL, Yang XL, Wang CX, et al. Hypertriglyceridemia and hyperuricemia: a retrospective study of urban residents [J]. Lipids in Health Dis, 2019, 18(1): 81. DOI: 10.1186/s12944-019-1031-6. [9] Nakanishi N, Tatara K, Nakamura K, et al. Risk factors for the incidence of hyperuricaemia: a 6-year longitudinal study of middle-aged Japanese men [J]. Int J Epidemiol, 1999, 28(5): 888-893. DOI: 10.1093/ije/28.5.888. [10] Qi JY, Dai XJ, Zhou BB, et al. Association between lipid profiles and serum urate: a cross-sectional study in southwestern China [J]. Int J Endocrinol, 2021: 2741131. DOI: 10.1155/2021/2741131. [11] Son M, Seo J, Yang S. Association between dyslipidemia and serum uric acid levels in Korean adults: Korea National Health and Nutrition Examination Survey 2016-2017[J]. PLoS One, 2020, 15(2): e0228684. DOI: 10.1371/journal.pone.0228684. [12] Derosa G, Maffioli P, Reiner Ž, et al. Impact of statin therapy on plasma uric acid concentrations: a systematic review and meta-analysis [J]. Drugs, 2016, 76: 947-956. DOI: 10.1007/s40265-016-0591-2. [13] Peng L, Liu LL, Ma NN, et al. The dose-response relationship of serum uric acid with Dyslipidaemia and its components: a cross-sectional study of a Chinese multi-ethnic cohort [J]. Lipids Health Dis, 2022, 21(1): 36. DOI: 10.1186/s12944-022-01647-5. [14] Zhang B, Zhai FY, Du SF, et al. The China health and nutrition survey, 1989-2011[J]. Obesy Rev, 2014, 15: 2-7. DOI: 10.1111/obr.12119. [15] Zhao YH, Hu YS, Smith JP, et al. Cohort profile: the China health and retirement longitudinal study (CHARLS) [J]. Int J Epidemiol, 2014, 43(1): 61-68. DOI: 10.1093/ije/dys203. [16] Fong C, Hazlett C, Imai K. Covariate balancing propensity score for a continuous treatment: application to the efficacy of political advertisements [J]. Ann Appl Stat, 2018, 12(1): 156-177. DOI: 10.1214/17-AOAS1101. [17] 中华医学会内分泌学分会. 中国高尿酸血症与痛风诊疗指南(2019) [J]. 中华内分泌代谢杂志, 2020, 36(1): 1-13. DOI: 10.3760/cma.j.issn.1000-6699.2020.01.001.Endocrinology Branch of Chinese Medical Association. Guideline for the diagnosis and management of hyperuricemia and gout in China (2019) [J]. Chin J Endocrinol Metab, 2020, 36(1): 1-13. DOI: 10.3760/cma.j.issn.1000-6699.2020.01.001. [18] Smajic' J, Hasic' S. High-density lipoprotein cholesterol, apolipoprotein E and atherogenic index of plasma are associated with risk of chronic kidney disease [J]. Med Glas (Zenica), 2018, 15(2): 115-121. DOI: 10.17392/962-18. [19] 邓丹. 痛风患者血脂比值与血尿酸关系的初步研究[D]. 衡阳: 南华大学, 2019.Deng D. Preliminary study on the relationship between blood lipid ratio and serum uric acid in gout patients [D]. Hengyang: University of South China, 2019. [20] 聂璐, 韩春姬, 全贞玉. 血脂与血尿酸及血液黏度的相关性研究[J]. 中国慢性病预防与控制, 2011, 19(6): 596-598. DOI: 10.3969/j.issn.1001-9448.2010.04.043.Nie L, Han CJ, Quan ZY. Relationship of Blood Lipid with Blood Uric Acid and Viscosity [J]. Chin J Prev Control Dis, 2011, 19(6): 596-598. DOI: 10.3969/j.issn.1001-9448.2010.04.043. -

 点击查看大图
计量
- 文章访问数: 124
- HTML全文浏览量: 97
- PDF下载量: 19
- 被引次数: 0