

-
摘要:
目的 肌少症是老年群体的常发疾病,高效地识别肌少症是保障老年群体健康的重要手段。 方法 基于上海市某医院共计2 544例被试者,根据2013―2019年选取纵向体检数据,结合年度指标的差值作为特征,构建不同的机器学习模型对老年人肌少症风险进行预测,并使用决策曲线分析,为临床决策者提供参考。 结果 预测模型结果显示,基于Light Gradient Boosting Machine(LightGBM)模型的预测准确率较高,受试者工作特征(receiver operating characteristic, ROC)曲线下面积(area under curve, AUC)达到0.913 4。决策曲线分析(decision curve analysis, DCA)表明,阈概率(判定肌少症的阈值)在0.01~0.42和0.84~0.92内,LightGBM模型的净收益较大;阈概率在0.42~0.50和0.60~0.67内,随机森林(random forest, RF)模型净收益较大;阈概率在0.50~0.60和0.67~0.84内,逻辑回归(logistic regression, LR)模型净收益较大。 结论 基于纵向体检数据和机器学习方法建立的预测模型可以有效地预测老年人未来肌少症的患病风险,对肌少症的早期诊断和干预具有重要价值。 Abstract:Objective In the elderly, sarcopenia is a common disease and efficient identification of sarcopenia is very important to keep health. Methods Based on the longitudinal physical examination data, a total of 2 544 subjects in a hospital from Shanghai during 2013-2019 were included. Considering the difference across annual indices, various machine learning models were constructed to predict the risk of sarcopenia in the elderly, and the decision curve analysis was applied to provide reference for clinical decision makers. Results The prediction models results showed that the prediction accuracy based on the Light Gradient Boosting Machine (LightGBM) model was relatively high (AUC=0.913 4). Decision curve analysis indicated that the net profit of the LightGBM model became larger when threshold probability (threshold for judging sarcopenia) ranged from 0.01 to 0.42 and from 0.84 to 0.92. And the net profit of the Random Forest model was larger when threshold probability ranged from 0.42 to 0.50 and from 0.60 to 0.67, while in the case of logistic regression model, the range was located in 0.50-0.60 and 0.67-0.84. Conclusions The prediction model established based on longitudinal physical examination data and machine learning methods can effectively predict the future risk of sarcopenia in the elderly, and is of great value for the early diagnosis and intervention of sarcopenia. -

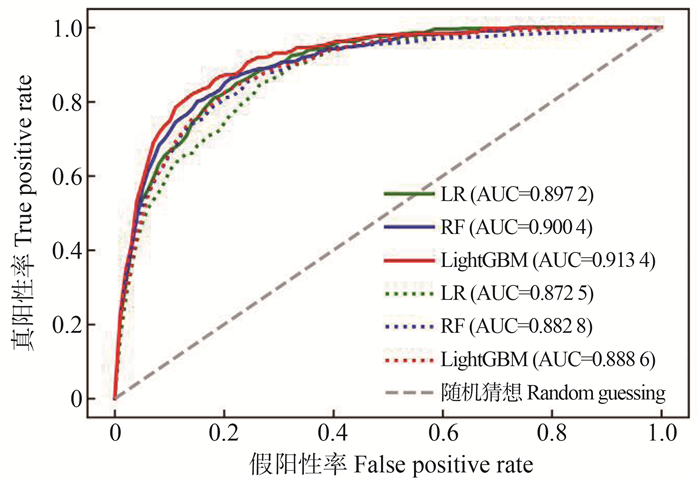
图 1 3种机器学习算法ROC曲线
1. LR,逻辑回归算法;RF,随机森林算法;LightGBM,LightGBM; AUC, 曲线下面积。
2. 实线为加入差值特征后预测效果,虚线为不引入差值特征的预测结果。Figure 1. ROC curves of three machine learning algorithms
1. LR, logistic regression; RF, random forest; LightGBM, light gradient boosting machine; AUC, area under curve.
2. The solid line is the prediction effect after adding the difference feature, and the dashed line is the prediction result without adding the difference feature.
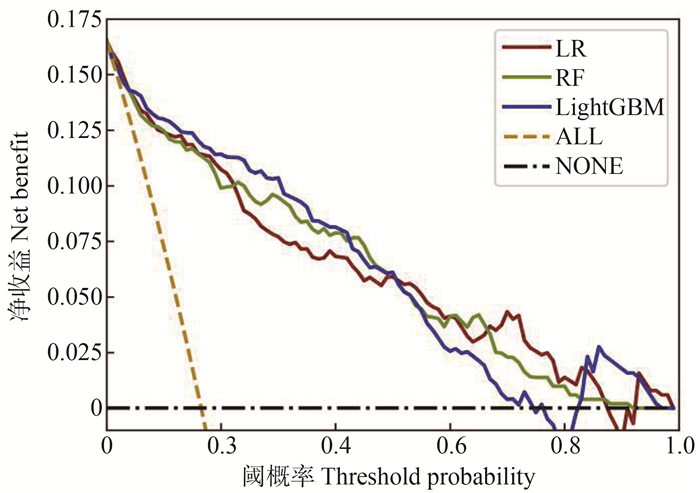
图 2 3种机器学习算法决策分析曲线
LR, 逻辑回归; RF, 随机森林; LightGBM, LightGBM; ALL, 干预所有人的净收益; NONE, 不干预任何人的净收益。
Figure 2. The decision curve analysis curves of three machine learning
LR, logistic regression; RF, random forest; LightGBM, light gradient boosting machine; ALL, net benefits of intervening for all; NONE, net benefits of intervening for none.
表 1 重复测量方差分析结果
Table 1. The results of repeated measures analysis of variance
特征Characteristics 组间效应Between-group effects 组内效应Within-group effects 交互效应Interaction effects F值value P值value F值value P值value F值value P值value 体重/kg Weight/kg 631.946 <0.001 85.868 <0.001 9.118 <0.001 身高/cm Height/cm 79.533 <0.001 490.441 <0.001 1.639 0.132 BMI/(kg·m-2) 606.510 <0.001 39.789 <0.001 7.937 <0.001 腰围/cm Waist circumference/cm 388.855 <0.001 48.777 <0.001 4.539 <0.001 臀围/cm Hip circumference/cm 470.593 <0.001 90.444 <0.001 9.861 <0.001 心率/bpm Heart rate/bpm 17.853 <0.001 96.120 <0.001 2.105 0.049 SBP/mmHg 13.678 <0.001 19.885 <0.001 0.987 0.433 DBP/mmHg 56.915 <0.001 131.226 <0.001 1.713 0.114  下载: 导出CSV
表 2 3种预测模型在测试集上分类结果
Table 2. Three prediction models classify results on the test set
预测结果Predicted results 实际结果 ① Actual results ① 合计 ① Total ① 2019年罹患肌少症
Sarcopenia in 20192019年未患肌少症
Non-sarcopenia in 2019LR-罹患肌少症LR-sarcopenia 52(61.90) 22(5.19) 74(14.57) LR-未患肌少症LR-non-sarcopenia 32(38.10) 402(94.81) 434(85.43) RF-罹患肌少症RF-sarcopenia 51(60.71) 20(4.72) 71(13.98) RF-未患肌少症RF-non-sarcopenia 33(39.29) 404(95.28) 437(86.02) LightGBM-罹患肌少症LightGBM-sarcopenia 48(57.14) 17(4.01) 65(12.80) LightGBM-未患肌少症LightGBM-non-sarcopenia 36(42.86) 407(95.99) 443(87.20) 合计Total 84(100.00) 424(100.00) 508(100.00) 注:1. LR,逻辑回归;RF,随机森林;LightGBM,LightGBM。
2. 算法预测是否患肌少症的人数,实际是否患肌少症的人数。
①以[人数(占比/%)] 表示。
Note: 1. LR, logistic regression; RF, random forest; LightGBM, light gradient boosting machine.
2. The algorithm predicts whether the number of people with sarcopenia,The actual number of people with sarcopenia.
① [Number of people (proportion/%)].
下载: 导出CSV
-
[1] Wiedmer P, Jung T, Castro JP, et al. Sarcopenia- Molecular mechanisms and open questions[J]. Ageing Res Rev, 2021, 65: 101200. DOI: 10.1016/j.arr.2020.101200. [2] Beaudart C, Zaaria M, Pasleau F, et al. Health outcomes of sarcopenia: a systematic review and meta-analysis[J]. PLoS One, 2017, 12(1): e0169548. DOI: 10.1371/journal.pone.0169548. [3] Bruyère O, Beaudart C, Ethgen O, et al. The health economics burden of sarcopenia: a systematic review[J]. Maturitas, 2019, 119: 61-69. DOI: 10.1016/j.maturitas.2018.11.003. [4] Rajkomar A, Dean J, Kohane I. Machine learning in medicine[J]. N Engl J Med, 2019, 380(14): 1347-1358. DOI: 10.1056/NEJMra1814259. [5] 欧阳平, 李小溪, 冷芬, 等. 机器学习算法在体检人群糖尿病风险预测中的应用[J]. 中华疾病控制杂志, 2021, 25(7): 849-853, 868. DOI: 10.16462/j.cnki.zhjbkz.2021.07.020.Ou YP, Li XX, Leng F, et al. Application of machi-ne learning algorithm in diabetes risk prediction of physical examination population[J]. Chin J Dis Control Prev, 2021, 25(7): 849-853, 868. DOI: 10.16462/j.cnki.zhjbkz.2021.07.020. [6] Lavalley MP. Logistic regression[J]. Circulation, 2008, 117(18): 2395-2399. DOI: 10.1161/circulationaha.106.682658. [7] Liu ZS, Siu WC, Chan YL. Features guided face super-resolution via hybrid model of deep learning and random forests[J]. IEEE Trans Image Process, 2021, 30: 4157-4170. DOI: 10.1109/TIP.2021.3069554. [8] Ke GL, Meng Q, Finley T, et al. LightGBM: a highly efficient gradient boosting decision tree[J]. NeurIPS Curran Associates Inc, 2017: 3149-3157. [9] Vickers AJ, Elkin EB. Decision curve analysis: a novel method for evaluating prediction models[J]. Med Decis Making, 2006, 26(6): 565-574. DOI: 10.1177/0272989X06295361. -

 点击查看大图
计量
- 文章访问数: 743
- HTML全文浏览量: 224
- PDF下载量: 61
- 被引次数: 0