

Comparison and application of Mendelian randomization methods for correcting weak instrumental variable bias
-
摘要:
目的 探究无工具变量可用或需评估弱工具变量偏倚对结果的影响时,为选择合适的两样本孟德尔随机化(two-sample Mendelian randomization, TwoSampleMR)方法提供建议。 方法 分别在无多效性、均衡多效性、正向多效性模拟情形下,变换工具变量强度考察弱工具变量对修正权重的逆方差加权模型(inverse variance weighting with modified weights, MW-IVW)、稳健校正轮廓评分(robust adjusted profile score, RAPS)孟德尔随机化方法和基于混合正态分布的孟德尔随机化模型(MR mixture model, MR-Mix)3种方法的影响。正向多效性和弱工具变量同时存在时,模拟不同个数工具变量对MR-Mix的影响。MR-Mix为主分析方法,其余2方法作为敏感性分析,探究BMI、高密度脂蛋白(high-density lipoprotein, HDL)、低密度脂蛋白(low-density lipoprotein, LDL)、三酰甘油(triglyceride,TG)以及总胆固醇(total cholesterol, TC)与血清尿酸之间的因果关联。 结果 无多效性和均衡多效性情形下,MW-IVW表现最佳,MR-Mix表现最差。正向多效性情况下,MR-Mix表现最好,MW-IVW表现最差。BMI(β=0.280, P=0.003)和TG(β=0.370, P < 0.001)是血清尿酸升高的危险因素,HDL(β=-0.250, P=0.002)是血清尿酸的保护因素。 结论 在无多效性和均衡多效性情形下,MW-IVW有更好的统计学性能;但当正向多效性存在时,MR-Mix有更好的稳健性。BMI和TG为血清尿酸升高的危险因素。 Abstract:Objective To provide suggestions to choose the appropriate two-sample Mendelian randomization methods when no instrumental variables are available or weak instrumental variable bias exist. Methods In the case of no pleiotropy, balanced pleiotropy, and directional pleiotropy, respectively, the impact of weak instrumental variables on each method was investigated by changing the intensity of instrumental variables. The study simulated different number of instrumental variables to access the impact on MR-Mix under the condition that both directional pleiotropic effects and weak instrumental variables existed. MR-Mix served as the primary analytical method, while the other two methods were employed as sensitivity analyses to explore the causal associations between BMI, HDL, LDL, TG, TC, and serum uric acid. Results Under scenarios of no pleiotropy and balanced pleiotropy, MW-IVW performed the best, while MR-Mix performed the worst. In the case of directional pleiotropic, MR-Mix exhibited the best performed, whereas MW-IVW performed the worst. BMI(β=0.280, P=0.003) and TG(β=0.370, P < 0.001) were identified as risk factors for elevated serum uric acid. HDL(β=-0.250, P=0.002) was identified as a protective factor. Conclusions Under scenarios of no pleiotropy and balanced pleiotropy, MW-IVW demonstrates better statistical performance. However, in the presence of directional pleiotropy, MR-Mix exhibits superior robustness. BMI and TG are identified as risk factors for elevated serum uric acid. -
Key words:
- Mendelian randomizaiton /
- Pleiotropy /
- Weak instruments /
- Body mass index /
- Lipid traits /
- Serum urate
-

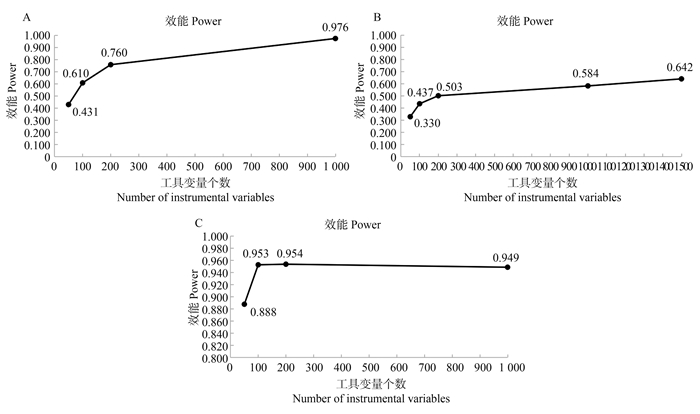
图 1 弱工具变量个数对MR-Mix效能的影响
图A: 无多效性情形弱工具变量个数对MR-Mix效能的影响; 图B: 均衡多效性情形弱工具变量个数对MR-Mix效能的影响; 图C: 正向多效性情形弱工具变量个数对MR-Mix效能的影响。
Figure 1. Effect of the number of weak tool variables on the performance of MR-Mix
Figure A: illustrates the effect of the number of weak instrumental variables on the efficiency of MR-Mix under the scenario of no pleiotropy; Figure B: illustrates the effect of the number of weak instrumental variables on the efficiency of MR-Mix under the scenario of balanced pleiotropy; Figure C: illustrates the effect of the number of weak instrumental variables on the efficiency of MR-Mix under the scenario of directional pleiotropy.
表 1 不同强度工具变量下各方法表现
Table 1. The performance of methods under different intensity tool variables
Mean F MW-IVW RAPS MR-Mix $\widehat{\beta}$(sx) TIE/P CF $\widehat{\beta}$(sx) TIE/P CF $\widehat{\beta}$(sx) TIE/P CF 无多效性方案No pleiotropy β=0 100 0.000(0.008) 0.055 0.948 0.000(0.008) 0.052 0.949 0.000(1.942) 0.003 0.998 50 0.000(0.008) 0.057 0.950 0.000(0.008) 0.053 0.948 0.000(1.308) 0.005 0.995 25 0.000(0.007) 0.051 0.955 0.000(0.008) 0.045 0.955 0.000(0.840) 0.005 0.995 10 0.000(0.006) 0.035 0.970 0.000(0.015) 0.050 0.951 0.000(0.897) 0.006 0.994 β=0.05 100 0.050(0.008) 1.000 0.950 0.051(0.008) 1.000 0.951 0.050(0.872) 0.458 0.995 50 0.050(0.008) 0.999 0.952 0.051(0.008) 0.999 0.956 0.051(0.513) 0.451 0.997 25 0.050(0.008) 1.000 0.965 0.054(0.009) 1.000 0.963 0.055(0.371) 0.420 0.999 10 0.050(0.007) 1.000 0.962 0.061(0.012) 1.000 0.958 0.060(0.251) 0.431 0.978 β=0.1 100 0.100(0.008) 1.000 0.952 0.101(0.008) 1.000 0.957 0.101(2.821) 0.683 0.997 50 0.100(0.008) 1.000 0.954 0.102(0.009) 1.000 0.961 0.102(0.439) 0.673 0.996 25 0.100(0.008) 1.000 0.962 0.105(0.010) 1.000 0.962 0.106(0.386) 0.702 0.998 10 0.100(0.008) 1.000 0.958 0.111(0.014) 1.000 0.977 0.100(0.117) 0.752 0.952 均衡多效性方案Balanced pleiotropy β=0 100 0.000(0.027) 0.058 0.949 0.000(0.036) 0.070 0.930 0.000(0.723) 0.007 0.993 50 0.000(0.010) 0.056 0.947 0.000(0.010) 0.075 0.925 0.000(0.753) 0.021 0.976 25 0.000(0.009) 0.057 0.946 0.000(0.011) 0.068 0.932 0.000(0.641) 0.019 0.981 10 0.000(0.008) 0.047 0.958 0.000(0.015) 0.061 0.939 0.000(0.493) 0.034 0.966 β=0.05 100 0.050(0.010) 0.996 0.951 0.051(0.010) 0.994 0.929 0.044(1.250) 0.503 0.981 50 0.050(0.009) 0.995 0.950 0.052(0.010) 0.993 0.930 0.048(0.652) 0.496 0.986 25 0.050(0.010) 0.998 0.959 0.055(0.011) 0.994 0.922 0.053(3.862) 0.443 0.988 10 0.050(0.009) 1.000 0.972 0.057(0.015) 0.999 0.938 0.060(2.129) 0.330 0.989 β=0.1 100 0.100(0.009) 1.000 0.954 0.101(0.010) 1.000 0.931 0.094(0.650) 0.699 0.987 50 0.100(0.010) 1.000 0.960 0.103(0.011) 1.000 0.934 0.097(0.844) 0.645 0.986 25 0.100(0.011) 1.000 0.969 0.108(0.012) 1.000 0.915 0.105(1.611) 0.528 0.996 10 0.100(0.010) 1.000 0.964 0.100(0.017) 1.000 0.947 0.100(0.338) 0.611 0.964 正向多效性方案Directional pleiotropy β=0 100 0.063(0.029) 0.477 0.544 0.000(0.007) 0.128 0.872 0.006(0.025) 0.055 0.945 50 0.060(0.030) 0.465 0.567 0.000(0.006) 0.193 0.807 0.002(0.041) 0.091 0.909 25 0.055(0.029) 0.379 0.642 0.001(0.005) 0.307 0.693 0.000(0.063) 0.044 0.956 10 0.021(0.026) 0.373 0.670 0.000(0.004) 0.571 0.429 0.001(0.034) 0.094 0.906 β=0.05 100 0.112(0.030) 1.000 0.548 0.051(0.007) 1.000 0.866 0.050(0.025) 0.909 0.943 50 0.110(0.029) 0.998 0.570 0.052(0.007) 1.000 0.824 0.045(0.031) 0.893 0.915 25 0.105(0.030) 0.985 0.665 0.055(0.006) 1.000 0.710 0.048(0.030) 0.886 0.960 10 0.107(0.030) 0.973 0.699 0.064(0.006) 1.000 0.398 0.058(0.054) 0.888 0.784 β=0.1 100 0.162(0.030) 1.000 0.550 0.101(0.007) 1.000 0.885 0.098(0.021) 0.955 0.953 50 0.160(0.030) 1.000 0.579 0.103(0.007) 1.000 0.833 0.085(0.161) 0.943 0.921 25 0.156(0.031) 1.000 0.673 0.107(0.007) 1.000 0.765 0.094(0.029) 0.934 0.942 10 0.160(0.031) 1.000 0.660 0.117(0.009) 1.000 0.566 0.098(0.139) 0.901 0.659 注:Mean F, 平均因果效应估计值; MW-IVW, 修正权重的逆方差加权方法; RAPS, 稳健校正的轮廓评分模型; MR-Mix, 效应大小混合正态分布的孟德尔随机化方法; sx, 标准误;TIE, 一型错误率; CF, 95% CI覆盖率。
Note: Mean F, average causal effect estimates; MW-IVW, inverse variance weighting with modified weights; RAPS, robust adjusting profile score; MR-Mix, Mendelian Randomization mixture model; sx, standard error; TIE, type I error; CF, 95% CI coverage frequency. 下载: 导出CSV
表 2 强、弱工具变量分析结果
Table 2. Analysis results of strong and weak instrumental variables
暴露
Exposure工具变量
Instrumental Variables方法
MethodsSNP个数
nSNPsβ值value
(95% CI)P值
valueBMI 强工具变量Strong instrumental variables IVW 20 -0.029(-0.064~0.006) 0.110 WME 20 -0.025(-0.031~-0.009) 0.012 MR-Egger 20 -0.065(-0.128~-0.002) 0.056 Egger-intercept 0.000(-0.002~0.010) 0.191 弱工具变量Weak instrumental variables MW-IVW 45 -0.009(-0.056~0.038) 0.700 RAPS 45 -0.013(-0.021~0.005) 0.024 MR-Mix 45 -0.020(-0.042~0.002) 0.058 HDL 强工具变量Strong instrumental variables IVW 21 -0.030(-0.085~0.025) 0.284 WME 21 -0.005(-0.023~0.013) 0.606 MR-Egger 21 0.052(-0.040~0.144) 0.284 Egger-intercept -0.008(-0.016~0.000) 0.048 弱工具变量Weak instrumental variables M-IVW 51 -0.039(-0.080~0.002) 0.067 RAPS 51 -0.014(-0.024~-0.004) 0.005 MR-Mix 51 0.000(-0.020~0.019) 1.000 LDL 强工具变量Strong instrumental variables IVW 21 -0.003(-0.070~0.064) 0.938 WME 21 0.003(-0.019~0.025) 0.752 MR-Egger 21 0.074(-0.042~0.190) 0.222 Egger-intercept -0.008(-0.018~0.002) 0.131 弱工具变量Weak instrumental variables MW-IVW 51 0.006(-0.037~0.049) 0.785 RAPS 51 0.007 (-0.003~0.017) 0.169 MR-Mix 51 -0.010(-0.026~0.006) 0.239 TG 强工具变量Strong instrumental variables IVW 21 0.109(-0.060~0.278) 0.203 WME 21 0.007(-0.011~0.025) 0.400 MR-Egger 21 -0.016(-0.316~0.284) 0.917 Egger-intercept 0.012(-0.013~0.037) 0.339 弱工具变量Weak instrumental variables MW-IVW 51 0.111(0.011~0.211) 0.030 RAPS 51 0.446(0.428~0.464) 0.000 MR-Mix 51 0.010(-0.033~0.053) 0.651 TC 强工具变量Strong instrumental variables IVW 25 0.049(-0.045~0.143) 0.300 WME 25 0.034(-0.003~0.071) 0.073 MR-Egger 25 0.143(-0.024~0.310) 0.105 Egger-intercept -0.009(-0.023~0.005) 0.197 弱工具变量Weak instrumental variables MW-IVW 53 0.047(-0.016~0.110) 0.146 RAPS 53 0.053(0.029~0.077) 0.534 MR-Mix 53 0.030(-0.025~0.085) 0.280 注:HDL, 高密度脂蛋白; LDL, 低密度脂蛋白; TG, 三酰甘油; TC, 总胆固醇; IVW, 逆方差加权方法; MWE, 加权中位数模型; MR-Egger, 孟德尔随机化-Egger方法; Egger-intercept, MR-Egger方法的截距项; MW-IVW, 修正权重的逆方差加权方法; RAPS, 稳健校正的轮廓评分模型; MR-Mix, 效应大小混合正态分布的孟德尔随机化方法。
Note: HDL, high-density lipoprotein; LDL, low-density lipoprotein; TG, triglyceride; TC, total cholesterol; IVW, inverse variance weighting; MWE, weighted median estimator; MW-IVW, inverse variance weighting with modified weights; RAPS, robust adjusting profile score; MR-Mix, Mendelian randomization mixture model.
下载: 导出CSV
表 3 逆向MR强、弱工具变量分析结果
Table 3. Analysis results of strong and weak instrumental variables of reverse MR
结局Outcome 工具变量
Instrumental variables方法
MethodsSNP个数
nSNPsβ值value (95% CI) P值
valueBMI 强工具变量Strong instrumental variables IVW 443 0.310(0.245~0.375) 7.799×10⁻²¹ WME 443 0.306(0.243~0.369) 9.027×10⁻²² MR-Egger 443 0.290(0.119~0.461) 9.153×10⁻⁴ Egger-intercept 0.000(-0.002~0.002) 0.807 弱工具变量Weak instrumental variables MW-IVW 638 0.312(0.259~0.365) 7.377×10⁻³⁰ RAPS 638 0.326(0.293~0.359) 0.000 MR-Mix 638 0.280(0.023~0.537) 0.003 HDL 强工具变量Strong instrumental variables IVW 109 -0.114(-0.181~-0.047) 0.0007 WME 109 -0.007(-0.062~0.076) 0.851 MR-Egger 109 -0.004(-0.104~0.096) 0.934 Egger-intercept -0.004(-0.006~-0.002) 0.005 弱工具变量Weak instrumental variables MW-IVW 178 -0.114(-0.169~-0.059) 4.570×10⁻⁵ RAPS 178 -0.098(-0.151~-0.045) 0.0003 MR-Mix 178 -0.250(-0.64~0.140) 0.002 LDL 强工具变量Strong instrumental variables IVW 50 0.019(-0.193~0.191) 0.826 WME 50 -0.017(-0.123~0.098) 0.755 MR-Egger 50 0.124(-0.195~0.443) 0.450 Egger-intercept -0.003(-0.013~0.007) 0.448 弱工具变量Weak instrumental variables MW-IVW 97 -0.069(-0.149~0.011) 0.091 RAPS 97 -0.070(-0.123~-0.017) 0.009 MR-Mix 97 -0.050(-0.156~0.056) 0.356 TG 强工具变量Strong instrumental variables IVW 174 0.223(0.154~0.292) 2.279×10⁻¹⁰ WME 174 0.154(0.068~0.240) 0.0004 MR-Egger 174 0.112(0.002~0.222) 4.661×10⁻² Egger-intercept 0.003(0.001~0.005) 0.013 弱工具变量Weak instrumental variables MW-IVW 362 0.221(0.166~0.276) 2.012×10⁻¹⁵ RAPS 362 0.229(0.192~0.266) 0.000 MR-Mix 362 0.370(0.192~0.548) 4.436×10⁻⁵ TC 强工具变量Strong instrumental variables IVW 77 -0.027(-0.105~0.051) 0.503 WME 77 -0.045(-0.102~0.012) 0.121 MR-Egger 77 0.069(-0.092~0.230) 0.405 Egger-intercept -0.005(-0.013~0.003) 0.185 弱工具变量Weak instrumental variables MW-IVW 125 -0.019(-0.082~-0.044) 0.560 RAPS 125 -0.020(-0.049~0.009) 0.186 MR-Mix 125 -0.040(-0.091~0.101) 0.127 注:HDL, 高密度脂蛋白; LDL, 低密度脂蛋白; TG, 三酰甘油; TC, 总胆固醇; IVW, 逆方差加权方法; MWE, 加权中位数模型; MR-Egger, 孟德尔随机化-Egger方法; Egger-intercept, MR-Egger方法的截距项; MW-IVW, 修正权重的逆方差加权方法; RAPS, 稳健校正的轮廓评分模型; MR-Mix, 效应大小混合正态分布的孟德尔随机化方法。
Note: HDL, high-density lipoprotein; LDL, low-density lipoprotein; TG, triglyceride; TC, total cholesterol; IVW, inverse variance weighting; MWE, weighted median estimator; MW-IVW, inverse variance weighting with modified weights; RAPS, robust adjusting profile score; MR-Mix, Mendelian randomization mixture model.
下载: 导出CSV
-
[1] Hernán MA, Robins JM. Instruments for causal inference: an epidemiologist's dream?[J]. Epidemiology(Cambridge, Mass), 2006, 17(4): 360-372. DOI: 10.1097/01.ede.0000222409.00878.37. [2] Emdin CA, Khera AV, Kathiresan S. Mendelian Randomization[J]. JAMA, 2017, 318(19): 1925-1926. DOI: 10.1001/jama.2017.17219. [3] Burgess S, Thompson S G. Use of allele scores as instrumental variables for Mendelian randomization[J]. Int J Epidemiol, 2013, 42(4): 1134-1144. DOI: 10.1093/ije/dyt093. [4] Burgess S, Butterworth A, Thompson SG. Mendelian randomization analysis with multiple genetic variants using summarized data[J]. Genet Epidemiol, 2013, 37(7): 658-665. DOI: 10.1002/gepi.21758. [5] Bowden J, Davey Smith G, Burgess S. Mendelian randomization with invalid instruments: effect estimation and bias detection through Egger regression[J]. Int J Epidemiol, 2015, 44(2): 512-525. DOI: 10.1093/ije/dyv080. [6] Bowden J, Davey Smith G, Haycock PC, et al. Consistent Estimation in Mendelian Randomization with Some Invalid Instruments Using a Weighted Median Estimator[J]. Genet Epidemiol, 2016, 40(4): 304-314. DOI: 10.1002/gepi.21965. [7] Bowden J, Del Greco MF, Minelli C, et al. Improving the accuracy of two-sample summary-data Mendelian randomization: moving beyond the NOME assumption[J]. Int J Epidemiol, 2019, 48(3): 728-742. DOI: 10.1093/ije/dyy258. [8] Qi G, Chatterjee N. Mendelian randomization analysis using mixture models for robust and efficient estimation of causal effects[J]. Nature Commun, 2019, 10(1): 1941. DOI: 10.1038/s41467-019-09432-2. [9] Zhao Q, Wang J, Hemani G, et al. Statistical inference in two-sample summary-data Mendelian randomization using robust adjusted profile score[J]. Ann Stat, 2020, 48(3). DOI: 10.1214/19-AOS1866. [10] Yengo L, Sidorenko J, Kemper KE, et al. Meta-analysis of genome-wide association studies for height and body mass index in 700000 individuals of European ancestry[J]. Hum Mol Geneti, 2018, 27(20): 3641-3649. DOI: 10.1093/hmg/ddy271. [11] Richardson TG, Sanderson E, Palmer TM, et al. Evaluating the relationship between circulating lipoprotein lipids and apolipoproteins with risk of coronary heart disease: A multivariable Mendelian randomisation analysis[J]. PLoS Med, 2020, 17(3): e1003062. DOI: 10.1371/journal.pmed.1003062 [12] Willer CJ, Schmidt EM, Sengupta S, et al. Discovery and refinement of loci associated with lipid levels[J]. Nat Genet, 2013, 45(11): 1274-1283. DOI: 10.1038/ng.2797. [13] Köttgen A, Albrecht E, Teumer A, et al. Genome-wide association analyses identify 18 new loci associated with serum urate concentrations[J]. Nat Genet, 2013, 45(2): 145-154. DOI: 10.1038/ng.2500. -

 点击查看大图
计量
- 文章访问数: 67
- HTML全文浏览量: 34
- PDF下载量: 14
- 被引次数: 0