

The spatio-temporal analysis and prediction model comparison of incidence rate of other infectious diarrhea diseases in Qinghai Province from 2017 to 2023
-
摘要:
目的 分析青海省其他感染性腹泻病(other infectious diarrhea disease, OIDD)流行情况与变化特点,为2024年青海省OIDD发病率提供预测。 方法 以2017年1月―2023年12月青海省OIDD的月发病率和年发病率为原始数据,利用Arcgis 10.8软件对青海省年发病率进行地图可视化,使用GeoDa 1.16软件进行空间自相关分析,使用R 4.3.1软件建立青海省OIDD的季节性自回归积分滑动平均(seasonal autoregressive integrated moving average, SARIMA)模型、三次指数平滑法(Holt-Winters)模型、神经网络自回归(neural network autoregression, NNAR)模型、指数平滑空间状态(trigonometric seasonality, Box-Cox transformation, TBATS)模型、先知模型。根据均方根误差(root mean square error, RMSE)、平均绝对误差(mean absolute error, MAE)、平均绝对百分比误差(mean absolute percentage error, MAPE)评价模型拟合效果。 结果 除Holt-Winters模型之外,各种模型均能较好地捕捉发病率趋势,其中NNAR模型训练集的MAE为0.90、RMSE为1.25、MAPE为16.43,在TBATS等模型中表现最好;NNAR模型测试集除RMSE值大于SARIMA模型和TBATS模型外,MAE和MAPE值均小于其他模型,总体而言预测性能最佳。因此,可基于NNAR模型对2024年青海省OIDD发病率做出预测,为高海拔地区的疾病预防策略做出启示。 结论 2017―2023年青海省西宁市、海东市、黄南藏族自治州为OIDD的高发地区。模型预测中,NNAR模型的预测效果最好,但在实际情况中需要结合各地区时空特征和流行趋势制定相应的防治措施。 -
关键词:
- 其他感染性腹泻病 /
- 神经网络自回归模型 /
- 模型预测 /
- 季节性自回归积分滑动平均模型 /
- 先知模型
Abstract:Objective To analyze the epidemiological trends and characteristics of other infectious diarrheal diseases(OIDD) in Qinghai Province, and to provide predictions for these diseases in Qinghai Province for 2024. Methods Using monthly and annual incidence rates of OIDD in Qinghai Province from January 2017 to December 2023 as primary data, the study employed ArcGIS 10.8 software for map visualization of annual incidence rates in Qinghai Province, and GeoDa 1.16 software for spatial autocorrelation analysis. R 4.3.1 software was used to construct various models for OIDD in Qinghai Province, including seasonal autoregressive integrated moving average (SARIMA) model, triple exponential smoothing (Holt-Winters) model, neural network autoregression (NNAR) model, trigonometric seasonality, Box-Cox transformation (TBATS) model, and Prophet model. The models′ fitting effects were evaluated using root mean square error (RMSE), mean absolute error (MAE), and mean absolute percentage error (MAPE). Results All models, except the Holt-Winters model, effectively captured the incidence rate trends. Among them, the NNAR model performed best in the training set, with MAE of 0.90, RMSE of 1.25, and MAPE of 16.43, outperforming models such as TBATS. In the test set, while its RMSE value was higher than those of the SARIMA and TBATS models, its MAE and MAPE values were lower than other models, indicating the best overall predictive performance. Therefore, the NNAR model can be used to forecast the incidence rate of OIDD in Qinghai Province for 2024, providing insights for disease prevention strategies in high-altitude regions. Conclusions From 2017 to 2023, Xining City, Haidong City, and Huangnan Tibetan Autonomous Prefecture in Qinghai Province were high-incidence areas for OIDD. Among the predictive models, the NNAR model showed the best performance. However, in practical applications, it is necessary to develop corresponding prevention and control measures by considering the spatiotemporal characteristics and epidemic trends of each region. -

图 1 青海省2017―2023年其他感染性腹泻病发病率地图
Figure 1. Visualization of incidence rate map of other infectious diarrhea diseases in Qinghai Province from 2017 to 2023

图 2 2017―2023年青海省其他感染性腹泻病局部自相关结果
Figure 2. Local autocorrelation results of other infectious diarrhea diseases in Qinghai Province from 2017 to 2023

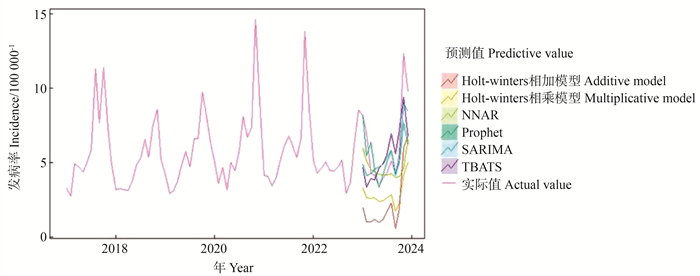
图 3 2017―2023年青海省其他感染性腹泻病预测图
NNAR:神经网络自回归模型;Prophet:先知模型;SARIMA:季节性自回归积分滑动模型;TBATS:指数平滑空间状态模型。
Figure 3. Prediction of other infectious diarrhea diseases in Qinghai Province from 2017 to 2023
NNAR: neural network autoregression model; Prophet: prophet model; SARIMA: seasonal autoregressive integrated moving average model; TBATS: trigonometric seasonality, Box-Cox transformation model.
表 1 2017―2023年青海省其他感染性腹泻病全局自相关分析结果
Table 1. Global autocorrelation analysis results of other infectious diarrhea diseases in Qinghai Province from 2017 to 2023
年份 Year Moran′s I值 value Z值 value P值 value 空间自相关性 Spatial autocorrelation 2017 0.828 6 10.287 0 0.001 正相关 Positive correlation 2018 0.583 0 6.693 9 0.001 正相关 Positive correlation 2019 0.700 2 8.484 9 0.001 正相关 Positive correlation 2020 0.720 8 8.484 9 0.001 正相关 Positive correlation 2021 0.720 2 8.659 6 0.001 正相关 Positive correlation 2022 0.514 3 0.085 7 0.001 正相关 Positive correlation 2023 0.454 6 0.087 5 0.001 正相关 Positive correlation  下载: 导出CSV
表 2 5种预测模型对青海省其他感染性腹泻病预测准确性比较
Table 2. Comparison of the accuracy of five predictive models in other infectious diarrhea diseases in Qinghai Province
数据集 Data set 模型 Model MAE值 value RMSE值 value MAPE值/% value 训练集 Training set SARIMA 1.01 1.60 18.08 Holt-Winters相加模型 Holt-Winters additive model 1.37 1.83 24.27 Holt-Winters相乘模型 Holt-Winters multiplication model 1.21 1.61 20.88 NNAR 0.90 1.25 16.43 TBATS 1.10 1.46 16.53 Prophet 1.92 2.67 70.12 测试集 Test set SARIMA 1.31 1.73 20.28 Holt-Winters相加模型 Holt-Winters additive model 3.79 4.04 66.48 Holt-Winters相乘模型 Holt-Winters multiplication model 3.11 3.70 48.27 NNAR 1.60 2.63 20.20 TBATS 1.83 2.13 29.60 Prophet 4.02 4.64 45.17 注:NNAR,神经网络自回归模型;Prophet,先知模型;SARIMA,季节性自回归积分滑动模型;TBATS,指数平滑空间状态模型。
Note: NNAR, neural network autoregression model; Prophet, prophet model; SARIMA, seasonal autoregressive integrated moving average model; TBATS, trigonometric seasonality, Box-Cox transformation model.
下载: 导出CSV
表 3 2024年发病率预测值
Table 3. Predicted incidence rate in 2024
月份 Mouth 1 2 3 4 5 6 7 8 9 10 11 12 预测值
Estimate value/%6.31 5.64 4.93 4.12 4.19 4.12 4.10 4.10 4.08 4.07 4.14 4.80
下载: 导出CSV
-
[1] Chen C, Guan Z, Huang CY, et al. Epidemiological trends and hotspots of other infectious diarrhea (OID) in mainland China: a population-based surveillance study from 2004 to 2017 [J]. Front Public Health, 2021, 9: 679853. DOI: 10.3389/fpubh.2021.679853. [2] 李欣, 靳金, 史雪宁, 等. 2010―2017年全国其他感染性腹泻空间聚集情况及预测[J]. 中华疾病控制杂志, 2022, 26(4): 376-379, 462. DOI: 10.16462/j.cnki.zhjbkz.2022.04.002.Li X, Jin J, Shi XN, et al. Spatial aggregation and prediction model of other infectious diarrhea in China from 2010 to 2017 [J]. Chin J Dis Control Prev, 2022, 26(4): 376-379, 462. DOI: 10.16462/j.cnki.zhjbkz.2022.04.002. [3] 任婧寰, 王锐. 2017―2021年我国其他感染性腹泻突发公共卫生事件流行特征分析[J]. 热带病与寄生虫学, 2023, 21(1): 1-6, 29. DOI: 10.3969/j.issn.1672-2302.2023.01.001.Ren JH, Wang R. Epidemiological characteristics of public health emergencies caused by other infectious diarrhea in China from 2017 to 2021 [J]. J Trop Dis Parasitol, 2023, 21(1): 1-6, 29. DOI: 10.3969/j.issn.1672-2302.2023.01.001. [4] Chen YG. Reconstruction and normalization of LISA for spatial analysis [J]. PLoS One, 2024, 19(5): e0303456. DOI: 10.1371/journal.pone.0303456. [5] Liu PB, Zhang XY, Deng GY, et al. Sociodemographic factors impacting the spatial distribution of private dental clinics in major cities of Peoples Republic of China [J]. Int Dent J, 2024, 74(5): 1089-1101. DOI: 10.1016/j.identj.2024.03.009. [6] Devi R, Agrawal A, Dhar J, et al. Forecasting of Indian tourism industry using modeling approach [J]. Methods X, 2024, 12: 102723. DOI: 10.1016/j.mex.2024.102723. [7] Almarashi AM, Daniyal M, Jamal F. Modelling the GDP of KSA using linear and non-linear NNAR and hybrid stochastic time series models [J]. PLoS One, 2024, 19(2): e0297180. DOI: 10.1371/journal.pone.0297180. [8] Chen QQ, Zheng XY, Shi HH, et al. Prediction of influenza outbreaks in Fuzhou, China: comparative analysis of forecasting models [J]. BMC Public Health, 2024, 24(1): 1399. DOI: 10.1186/s12889-024-18583-x. [9] 刘泽, 张娜娜, 程杨, 等. 青海省医疗资源配置的空间公平与效率评价[J]. 地理科学进展, 2023, 42(10): 1891-1903. DOI: 10.18306/dlkxjz.2023.10.003.Liu Z, Zhang NN, Cheng Y, et al. Spatial equity and efficiency of medical resource allocation in Qinghai Province [J]. Progress in Geographic Sciences, 2023, 42(10): 1891-1903. DOI: 10.18306/dlkxjz.2023.10.003. [10] 郝彩霞, 刘雅琼, 廖雪春, 等. 2017―2021年四川省其他感染性腹泻流行特征分析[J]. 热带病与寄生虫学, 2023, 21(1): 7-12, 24. DOI: 10.3969/j.issn.1672-2302.2023.01.002.Hao CX, Liu YQ, Liao XC, et al. Epidemiological characteristics of other infectious diarrhea in Sichuan Province from 2017 to 2021 [J]. J Trop Dis Parasitol, 2023, 21(1): 7-12, 24. DOI: 10.3969/j.issn.1672-2302.2023.01.002. [11] 沈秀莲, 何继波, 黄甜, 等. 云南省2005―2022年其他感染性腹泻流行病学特征及趋势分析[J]. 中国热带医学, 2024, 24(9): 1153-1160. DOI: 10.13604/j.cnki.46-1064/r.2024.09.23.Shen XL, He JB, Huang T, et al. Epidemiological characteristics and trend analysis of other infectious diarrhea in Yunnan Province from 2005 to 2022 [J] China Tropical Medcine, 2024, 24(9): 1153-1160 DOI: 10.13604/j.cnki.46-1064/r.2024.09.23. [12] 郭珍, 陈莉. 2017―2022年东海县牛山街道疑似预防接种异常反应监测分析及预测[J]. 现代医学, 2024, 52(3): 421-426. DOI: 10.3969/j.issn.1671-7562.2024.03.014.Guo Z, Chen L. Monitoring, analysis and prediction of suspected adverse reaction to vaccination in Niu Shan street of Donghai County from 2017 to 2022 [J]. Mod Med J, 2024, 52(3): 421-426. DOI: 10.3969/j.issn.1671-7562.2024.03.014. [13] 马晨哲, 王霄, 杨波, 等. 基于ARIMA与NNAR模型的甘肃省胰腺癌发病趋势预测[J]. 现代肿瘤医学, 2024, 32(11): 2080-2084. DOI: 10.3969/j.issn.1672-4992.2024.11.023.Ma CZ, Wang X, Yang B, et al. Prediction of incidence trend of pancreatic cancer in Gansu Province based on ARIMA and NNAR models [J] Modern Oncology, 2024, 32(11): 2080-2084 DOI: 10.3969/j.issn.1672-4992.2024.11.023. [14] Kuan MM. Applying SARIMA, ETS, and hybrid models for prediction of tuberculosis incidence rate in Taiwan [J]. PeerJ, 2022, 10: e13117. DOI: 10.7717/peerj.13117. [15] Hoxha E, Francart N, Tozan B, et al. Spatiotemporal tracking of building materials and their related environmental impacts [J]. Sci Total Environ, 2024, 912: 168853. DOI: 10.1016/j.scitotenv.2023.168853. [16] Hasan MM, Ng KTW, Ray S, et al. Prophet time series modeling of waste disposal rates in four North American cities [J]. Environ Sci Pollut Res, 2024, 31(21): 31343-31354. DOI: 10.1007/s11356-024-33335-5. [17] 温福东, 赵彬宇, 苏月, 等. 基于Prophet模型预测中国布鲁氏菌病发病人数[J]. 中国医院统计, 2024, 31(1): 7-10. DOI: 10.3969/j.issn.1006-5253.2024.01.002.Wen FD, Zhao BY, Su Y, et al. Predicting the incidence of brucellosis in China based on the Prophet model [J] Chinese Hospital Statistics, 2024, 31(1): 7-10 DOI: 10.3969/j.issn.1006-5253.2024.01.002. -


 点击查看大图

计量
- 文章访问数: 136
- HTML全文浏览量: 46
- PDF下载量: 22
- 被引次数: 0