

Analysis of the characteristics of influenza-like illness cases and the association with two types of atmospheric particulate matter, PM10 and PM2.5, in Jiangsu Province from 2018 to 2023
-
摘要:
目的 分析2018―2023年江苏省流行性感冒(简称流感)样病例(influenza-like illness, ILI)流行特征,探讨不同人群ILI与可吸入颗粒物(inhalable particulate matter, PM10)和细颗粒物(fine particulate matter, PM2.5)之间的关联,为流感防控提供依据。 方法 基于2018―2023年江苏省各地级市流感监测哨点医院报告的ILI数据,描述ILI和ILI百分比(ILI%)的分布情况。采用分布滞后非线性模型与广义相加模型的联合嵌套模型,探讨PM2.5和PM10对不同人群ILI的影响。 结果 2018―2023年江苏省不同年份和地区的ILI分布情况不同(均P < 0.05)。ILI与PM2.5和PM10均呈正相关(r=0.35, P<0.05)。较高浓度的PM2.5和PM10对ILI具有滞后期不同的致病效应:PM2.5在P75和P95浓度下对全人群ILI发病风险有滞后0~1周的影响(RRmax=1.27, 95% CI: 1.00~1.62),而PM10在P75和P95浓度下对全人群ILI发病风险有滞后0~7周的影响(RRmax=1.27, 95% CI: 1.02~1.57)。不同人群ILI所受影响程度不同。 结论 高浓度PM2.5和PM10对ILI呈现显著但滞后期不同的致病风险:PM2.5以短期(滞后0~1周)效应为主,PM10则具有长期累积(滞后0~7周)效应。应关注PM2.5和PM10的浓度变化,在高污染时期减少人群外出,同时关注PM2.5和PM10的滞后效应,及时发出健康风险信号,加强对0~15岁人群的保护。 Abstract:Objective To examine the epidemiological patterns of influenza-like illness (ILI) in Jiangsu Province from 2018 to 2023, to assess the relationships between ILI in various population groups and inhalable particulate matter (PM10) and fine particulate matter (PM2.5), and to offer evidence to support influenza prevention and control strategies. Methods Based on ILI data collected from influenza surveillance sentinel hospitals in prefecture-level cities across Jiangsu Province between 2018 and 2023, the distribution and trends of ILI and the proportion of ILI cases (ILI%) were outlined. A combined nested model of the distributed lag non-linear model (DLNM) and the generalized additive model (GAM) was used to assess the impacts of PM2.5 and PM10 on ILI across various population groups. Results From 2018 to 2023, ILI distribution in Jiangsu Province showed significant variations across years and regions (P < 0.05). Clear positive correlations were found between ILI and both PM2.5 and PM10 (r=0.35, P < 0.05). Higher concentrations of PM2.5 and PM10 have significant pathogenic effects on ILI with different lag periods. At P75 and P95 concentrations, PM2.5 significantly raised the ILI risk in the general population with a lag of 0-1 weeks (RRmax=1.27, 95% CI: 1.00-1.62), whereas PM10 at P75 and P95 concentrations markedly increased the ILI risk with a lag of 0-7 weeks (RRmax=1.27, 95% CI: 1.02-1.57). The degree of ILI impact varied among population groups. Conclusions High concentrations of PM2.5 and PM10 present significant but differently delayed pathogenic risks for ILI: PM2.5 mainly has short-term (0-1 week lag) effects, while PM10 has long-term cumulative (0-7 week lag) effects. Monitoring changes in PM2.5 and PM10 concentrations is essential. During high pollution periods, efforts should be made to reduce population exposure, with attention to the lag effects of PM2.5 and PM10. Prompt health risk warnings should be issued, and special measures should be taken to protect people aged 0- < 15 years old. -

图 1 不同滞后期的PM10与PM2.5对不同人群ILI的影响
A、B:全人群; C、D:0~<15岁; E、F:15~<60岁; G、H:≥60岁; ILI:流行性感冒样病例; PM10:可吸入颗粒物; PM2.5:细颗粒物。
Figure 1. The impact of PM10 and PM2.5 on ILI in different populations with different lag periods
A, B: general population; C, D: 0- < 15 years old; E, F: 15- < 60 years old; G, H: ≥60 years old; ILI: influenza-like illness; PM10: inhalable particulate matter; PM2.5: fine particulate matter.

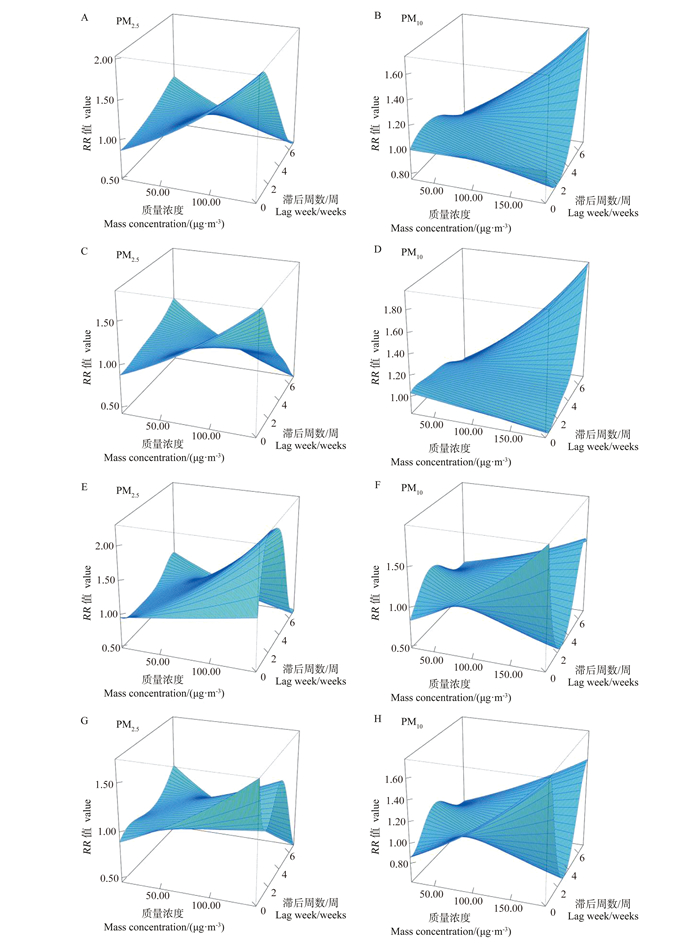
图 2 不同质量浓度与滞后期的PM10与PM2.5对不同人群ILI的影响3D图
A、B:全人群; C、D:0~<15岁; E、F:15~<60岁; G、H:≥60岁; ILI:流行性感冒样病例; PM10:可吸入颗粒物; PM2.5:细颗粒物。
Figure 2. 3D plot of the impact of PM10 and PM2.5 with different mass concentrations and lag periods on ILI in different populations
A, B: general population; C, D: 0- < 15 years old; E, F: 15- < 60 years old; G, H: ≥60 years old; ILI: influenza-like illness; PM10: inhalable particulate matter; PM2.5: fine particulate matter.
表 1 2018―2023年江苏省ILI发病情况
Table 1. Disease occurrence of ILI in Jiangsu Province from 2018 to 2023
变量
VariableILI病例数
Number of ILI cases①门/急诊就诊数
Number of outpatient/emergency visits①ILI/% χ2值
valueP值
value年份Year 359 774 < 0.001 2018 1 063 218(21.59) 13 896 230(17.66) 7.65 2019 966 951(19.63) 14 035 073(17.84) 6.89 2020 544 411(11.05) 9 380 018(11.92) 5.80 2021 489 077(9.93) 12 267 997(15.59) 3.99 2022 533 407(10.83) 12 782 558(16.25) 4.17 2023 1 328 233(26.97) 16 319 091(20.74) 8.14 地区Region 47 266 < 0.001 苏北Northern Jiangsu 1 019 725(20.70) 19 240 113(24.45) 5.30 苏中Central Jiangsu 690 483(14.02) 9 615 723(12.22) 7.18 苏南Southern Jiangsu 3 215 089(65.28) 49 825 131(63.33) 6.45 年龄/岁Age/years — — 0~<5 2 723 035(55.29) — — 5~<15 1 451 680(29.47) — — 15~<25 202 182(4.11) — — 25~<60 406 309(8.25) — — ≥60 142 091(2.88) — — 合计Total 4 925 297(100.00) 78 680 967(100.00) 6.26 注:ILI,流行性感冒样病例; “—”表示数据无法获取。
①以人数(占比/%)表示。
Note: ILI, influenza-like illness; "—" indicates that the data cannot be obtained.
① Number of people (proportion/%). 下载: 导出CSV
表 2 PM10与PM2.5对不同人群ILI影响的累积滞后效应
Table 2. Cumulative lag effects of PM10 and PM2.5 on ILI in different populations
变量Variable RR值value (95% CI) 0周weeks 0~1周weeks 0~4周weeks 0~7周weeks 全人群General population/(μg·m-3) P75(PM2.5) 1.08(1.00~1.18) 1.08(1.00~1.17) 1.01(0.96~1.07) 0.92(0.85~0.99) P95(PM2.5) 1.27(1.00~1.62) 1.26(1.00~1.59) 1.04(0.88~1.22) 0.78(0.62~0.98) P75(PM10) 1.00(0.92~1.09) 0.96(0.88~1.05) 0.99(0.93~1.05) 1.09(1.01~1.18) P95(PM10) 1.00(0.80~1.27) 0.91(0.72~1.14) 0.96(0.82~1.13) 1.27(1.02~1.57) 0~<15岁0-<15 years old/(μg·m-3) P75(PM2.5) 1.10(1.01~1.19) 1.08(1.00~1.17) 1.00(0.95~1.06) 0.92(0.85~0.99) P95(PM2.5) 1.31(1.02~1.68) 1.26(0.99~1.60) 1.01(0.85~1.19) 0.78(0.61~0.98) P75(PM10) 0.98(0.90~1.07) 0.96(0.88~1.05) 0.99(0.94~1.06) 1.10(1.01~1.19) P95(PM10) 0.95(0.74~1.21) 0.90(0.71~1.14) 0.99(0.84~1.16) 1.29(1.04~1.60) 15~<60岁15-<60 years old/(μg·m-3) P75(PM2.5) 1.03(0.91~1.16) 1.10(0.97~1.24) 1.08(0.99~1.18) 0.92(0.81~1.05) P95(PM2.5) 1.09(0.76~1.55) 1.32(0.92~1.88) 1.25(0.97~1.62) 0.79(0.54~1.15) P75(PM10) 1.12(0.99~1.27) 0.98(0.86~1.12) 0.93(0.84~1.03) 1.06(0.93~1.21) P95(PM10) 1.35(0.97~1.88) 0.95(0.67~1.36) 0.83(0.63~1.08) 1.16(0.82~1.66) ≥60岁≥60 years old/(μg·m-3) P75(PM2.5) 1.07(0.95~1.20) 1.02(0.90~1.14) 1.04(0.95~1.14) 0.91(0.80~1.04) P95(PM2.5) 1.21(0.85~1.71) 1.05(0.74~1.48) 1.13(0.86~1.47) 0.76(0.52~1.12) P75(PM10) 1.09(0.97~1.24) 1.05(0.93~1.19) 0.94(0.85~1.04) 1.07(0.94~1.21) P95(PM10) 1.27(0.92~1.77) 1.14(0.81~1.58) 0.85(0.65~1.11) 1.19(0.84~1.68) 注:ILI,流行性感冒样病例; PM10,可吸入颗粒物; PM2.5,细颗粒物。
Note: ILI, influenza-like illness; PM10, inhalable particulate matter; PM2.5, fine particulate matter.
下载: 导出CSV
-
[1] Uyeki TM, Hui DS, Zambon M, et al. Influenza[J]. Lancet, 2022, 400(10353): 693-706. DOI: 10.1016/S0140-6736(22)00982-5. [2] 庄雅丽, 卢捷, 吴树凯, 等. 广东省2015-2022年流感暴发疫情特征分析[J]. 中华流行病学杂志, 2023, 44(6): 942-948. DOI: 10.3760/cma.j.cn112338-20221010-00867.Zhuang YL, Lu J, Wu SK, et al. Epidemiologic characteristics and influencing factors of influenza outbreaks in Guangdong Province, 2015-2022[J]. Chin J Epidemiol, 2023, 44(6): 942-948. DOI: 10.3760/cma.j.cn112338-20221010-00867. [3] GBD 2021 Risk Factors Collaborators. Global burden and strength of evidence for 88 risk factors in 204 countries and 811 subnational locations, 1990-2021: a systematic analysis for the global burden of disease study 2021[J]. Lancet, 2024, 403(10440): 2162-2203. DOI: 10.1016/S0140-6736(24)00933-4. [4] Li XG, Xu J, Wang W, et al. Air pollutants and outpatient visits for influenza-like illness in Beijing, China[J]. PeerJ, 2021, 9: e11397. DOI: 10.7717/peerj.11397. [5] Yu LJ, Li XL, Wang YH, et al. Short-term exposure to ambient air pollution and influenza: a multicity study in China[J]. Environ Health Perspect, 2023, 131(12): 127010. DOI: 10.1289/EHP12146. [6] Sun R, Tao J, Tang N, et al. Air pollution and influenza: a systematic review and meta-analysis[J]. Iran J Public Health, 2024, 53(1): 1-11. DOI: 10.18502/ijph.v53i1.14678. [7] Zeng H, Cai MH, Li SQ, et al. Epidemiological characteristics of seasonal influenza under implementation of zero-COVID-19 strategy in China[J]. J Infect Public Health, 2023, 16(8): 1158-1166. DOI: 10.1016/j.jiph.2023.05.014. [8] Li ZR, Xiong Y, Long J, et al. Resurgence of influenza during COVID-19 in Chongqing, China: a retrospective analysis[J]. J Med Virol, 2023, 95(11): e29249. DOI: 10.1002/jmv.29249. [9] Cohen R, Ashman M, Taha MK, et al. Pediatric infectious disease group (GPIP) position paper on the immune debt of the COVID-19 pandemic in childhood, how can we fill the immunity gap?[J]. Infect Dis Now, 2021, 51(5): 418-423. DOI: 10.1016/j.idnow.2021.05.004. [10] Liu XF, Peng Y, Chen Z, et al. Impact of non-pharmaceutical interventions during COVID-19 on future influenza trends in Mainland China[J]. BMC Infect Dis, 2023, 23(1): 632. DOI: 10.1186/s12879-023-08594-1. [11] Davis WW, Mott JA, Olsen SJ. The role of non-pharmaceutical interventions on influenza circulation during the COVID-19 pandemic in nine tropical Asian countries[J]. Influenza Other Respir Viruses, 2022, 16(3): 568-576. DOI: 10.1111/irv.12953. [12] Lei H, Zhang N, Niu B, et al. Effect of rapid urbanization in Mainland China on the seasonal influenza epidemic: spatiotemporal analysis of surveillance data from 2010 to 2017[J]. JMIR Public Health Surveill, 2023, 9: e41435. DOI: 10.2196/41435. [13] Peng JL, Xu K, Tong Y, et al. Epidemiological characteristics of influenza outbreaks in schools in Jiangsu Province, China, 2020-2023 post-COVID-19 pandemic[J]. BMC Infect Dis, 2024, 24(1): 1189. DOI: 10.1186/s12879-024-10079-8. [14] Zhang Y, Wang SJ, Feng ZX, et al. Influenza incidence and air pollution: findings from a four-year surveillance study of prefecture-level cities in China[J]. Front Public Health, 2022, 10: 1071229. DOI: 10.3389/fpubh.2022.1071229. [15] Toczylowski K, Wietlicka-Piszcz M, Grabowska M, et al. Cumulative effects of particulate matter pollution and meteorological variables on the risk of influenza-like illness[J]. Viruses, 2021, 13(4): 556. DOI: 10.3390/v13040556. [16] Song Y, Zhang Y, Wang TT, et al. Spatio-temporal differentiation in the incidence of influenza and its relationship with air pollution in China from 2004 to 2017[J]. Chin Geogr Sci, 2021, 31(5): 815-828. DOI: 10.1007/s11769-021-1228-2. [17] Su W, Wu XG, Geng XY, et al. The short-term effects of air pollutants on influenza-like illness in Jinan, China[J]. BMC Public Health, 2019, 19(1): 1319. DOI: 10.1186/s12889-019-7607-2. [18] Lu B, Wang YC, Zhu ZS, et al. Epidemiological and genetic characteristics of influenza virus and the effects of air pollution on laboratory-confirmed influenza cases in Hulunbuir, China, from 2010 to 2019[J]. Epidemiol Infect, 2020, 148: e159. DOI: 10.1017/S0950268820001387. [19] Zhang JJ, Mu Q. Air pollution and defensive expenditures: evidence from particulate-filtering facemasks[J]. J Environ Econ Manag, 2018, 92: 517-536. DOI: 10.1016/j.jeem.2017.07.006. [20] Feng C, Li J, Sun WJ, et al. Impact of ambient fine particulate matter (PM2.5) exposure on the risk of influenza-like-illness: a time-series analysis in Beijing, China[J]. Environ Health, 2016, 15: 17. DOI: 10.1186/s12940-016-0115-2. [21] Li NX, Friedrich R, Schieberle C. Exposure of individuals in Europe to air pollution and related health effects[J]. Front Public Health, 2022, 10: 871144. DOI: 10.3389/fpubh.2022.871144. [22] 胡婷, 彭质斌, 张彦平. 部分国家和地区重点病毒性呼吸道传染病监测情况概述[J]. 中华流行病学杂志, 2024, 45(2): 300-304. DOI: 10.3760/cma.j.cn112338-20230630-00408.Hu T, Peng ZB, Zhang YP. Summary of key viral respiratory infectious diseases surveillance in some countries and regions in the world[J]. Chin J Epidemiol, 2024, 45(2): 300-304. DOI: 10.3760/cma.j.cn112338-20230630-00408. -

 点击查看大图

计量
- 文章访问数: 14
- HTML全文浏览量: 6
- PDF下载量: 3
- 被引次数: 0