

Characteristics and trend analysis of influenza epidemic in China, 2004-2021
-
摘要:
目的 分阶段分析2004―2021年中国流行性感冒(简称流感)发病和死亡情况,为流感防控策略提供科学依据。 方法 数据来源于公共卫生科学数据中心流感年发病和死亡数据,采用Excel 2019软件建立流感发病和死亡数据库,使用R 4.3.1软件进一步分析处理数据,运用Joinpoint 5.0.2软件分析全国、各省(市、自治区)、各年龄段流感年度变化趋势。 结果 2004―2021年中国共报告8 103 459例流感病例,年均报告发病率为32.45/10万,年均报告病死率为8.82/10万。平均年度变化百分比为14.55%(95% CI: 9.00%~22.78%, P<0.001),整体呈上升趋势。年均报告发病率前3名的省(市、自治区)分别为北京市、浙江省、广东省; 年均报告死亡率前3位的省(市、自治区)分别为北京市、天津市、重庆市; 年均报告病死率前3名的省(市、自治区)分别为新疆维吾尔自治区(简称新疆)、青海省、山东省,仅有海南省、西藏自治区未出现死亡病例。山西省、浙江省、安徽省的年发病率上升幅度最大(均P<0.05)。0~<15岁年龄组为流感高发人群,占总病例数的67.40%(5 462 111/8 103 459),年均报告死亡率与年均报告病死率最高的年龄组均为≥85岁年龄组,各年龄组年报告发病率均呈上升趋势。 结论 2004―2021年中国流感发病率呈先上升(2004―2019年)后下降(2019―2021年)趋势,除天津市、贵州省外,各省(市、自治区)整体均呈上升趋势。建议在北京市、天津市等人口密集区域,以及新疆、青海省等医疗资源不丰富的城市增设流感报告监测点,减少地区间的医疗服务差距,提升儿童和老年人流感疫苗接种比例。 -
关键词:
- 流行性感冒 /
- 报告发病率 /
- 流行特征 /
- Joinpoint回归模型
Abstract:Objective To analyze the morbidity and mortality of influenza (referred to as influenza) in China from 2004 to 2021 in stages, and to provide scientific basis for influenza prevention and control strategies. Methods The data were obtained from the annual morbidity and mortality data of influenza from the Public Health Science Data Center. Excel 2019 software was used to establish the influenza morbidity and mortality database. R 4.3.1 software was used to further analyze and process the data. And Joinpoint 5.0.2 software was used to analyze the annual change trend of influenza across China, in each province (city and autonomous region) and within each age group., and the annual trend of influenza in each age group. Results A total of 8 103 459 cases of influenza were reported in China from 2004 to 2021, with an average annual reported incidence rate of 32.45/100 000 and an average annual reported case-fatality rate of 8.82/100 000. The average annual percentage change was 14.55% (95% CI: 9.00%-22.78%, P < 0.001), with an overall increasing trend. The top 3 provinces in terms of average annual reported morbidity were Beijing, Zhejiang, and Guangdong; the top 3 provinces in terms of average annual reported mortality were Beijing, Tianjin, and Chongqing; and the top 3 provinces in terms of average annual reported morbidity and mortality were Xinjiang, Qinghai, and Shandong, with only two provinces, Hainan and Tibet, showing no fatal cases. Shanxi, Zhejiang, and Anhui had the greatest increase in annual incidence rates (all P < 0.05). The age group of 0- < 15 years old had the highest incidence of influenza, accounting for 67.40% of the total number of cases (5 462 111/8 103 459), and the age group with the highest annual average reported mortality rate and annual average reported case-fatality rate was the group of ≥85 years old, and the annual reported incidence rates of all age groups showed an increasing trend. Conclusions From 2004 to 2021, incidence rate of influenza in China showed an increasing (2004-2019) and then decreasing (2019-2021) trend, and all provinces (autonomous regions and municipalities directly under the central government), except Tianjin and Guizhou, showed an overall increasing trend. It is recommended that additional influenza reporting and surveillance sites be established in densely populated areas such as Beijing and Tianjin, and in cities that are not rich in healthcare resources, such as Xinjiang and Qinghai, to reduce the disparity of healthcare services between regions and to increase the proportion of influenza vaccination for children and the elderly. -
Key words:
- Influenza /
- Reported incidence /
- Epidemic characteristic /
- Joinpoint regression model
-

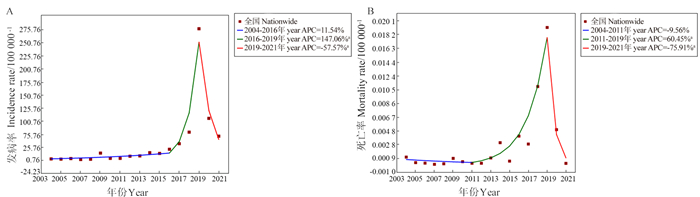
图 1 2004―2021年中国流行性感冒年发病率和死亡率的Joinpoint分析
A:中国流行性感冒年发病率趋势图; B:中国流行性感冒年死亡率趋势图; APC:年度变化百分比。a:P<0.05。
Figure 1. Joinpoint analysis of annual influenza morbidity and mortality in China, 2004-2021
A: the trend chart of annual incidence rate of influenza in China; B: the trend chart of annual mortality rate of influenza in China; APC: annual percentage change. a: P < 0.05.
表 1 2004―2021年中国各省(市、自治区)流行性感冒发病和死亡情况
Table 1. Influenza morbidity and mortality in Chinese provinces (municipalities/autonomous regions), 2004-2021
地区
Region病例数
Number of cases发病率
Incidence rate/100 000-1死亡数
Number of deaths死亡率
Mortality rate/100 000-1病死率
Fatality rate/100 000-1北京市Beijing 516 396 133.44 132 0.034 4 25.56 天津市Tianjin 52 784 19.74 21 0.007 8 39.78 河北省Hebei 510 992 38.36 30 0.002 2 5.87 山西省Shanxi 87 354 13.32 11 0.001 7 12.59 内蒙古自治区Inner Mongolia 36 706 8.18 10 0.002 2 27.24 辽宁省Liaoning 25 921 3.31 2 0.000 3 7.72 吉林省Jilin 17 434 3.56 5 0.001 0 28.68 黑龙江省Heilongjiang 18 603 2.74 6 0.000 9 32.25 上海市Shanghai 90 504 21.07 2 0.000 5 2.21 江苏省Jiangsu 183 986 12.75 21 0.001 5 11.41 浙江省Zhejiang 987 316 95.23 20 0.002 0 2.03 安徽省Anhui 270 984 24.12 25 0.002 2 9.23 福建省Fujian 140 587 20.15 9 0.001 3 6.40 江西省Jiangxi 167 740 20.37 5 0.000 6 2.98 山东省Shandong 166 642 9.29 68 0.003 8 40.81 河南省Henan 547 721 31.68 52 0.003 0 9.49 湖北省Hubei 551 781 52.05 10 0.000 9 1.81 湖南省Hunan 787 428 64.10 19 0.001 6 2.41 广东省Guangdong 1 404 988 69.83 63 0.003 2 4.48 广西壮族自治区Guangxi 252 201 28.61 35 0.004 0 13.88 海南省Hainan 41 141 24.20 0 0 0 重庆市Chongqing 155 624 28.19 40 0.007 2 25.70 四川省Sichuan 394 034 26.24 49 0.003 2 12.44 贵州省Guizhou 74 900 11.38 7 0.001 1 9.35 云南省Yunnan 102 117 11.97 15 0.001 8 14.69 西藏自治区Tibet 5 397 9.76 0 0 0 陕西省Shaanxi 328 796 47.34 15 0.002 2 4.56 甘肃省Gansu 99 639 21.27 10 0.002 1 10.04 青海省Qinghai 11 024 10.39 5 0.004 7 45.36 宁夏回族自治区Ningxia 20 528 17.53 2 0.001 7 9.74 新疆维吾尔自治区Xinjiang 52 191 12.13 26 0.006 0 49.82 全国Nationwide 8 103 459 32.45 715 0.002 9 8.82  下载: 导出CSV
表 2 2004―2021年中国各省(市、自治区)流行性感冒发病率Joinpoint分析
Table 2. Joinpoint analysis of influenza incidence rates by province (municipalities/autonomous region), 2004-2021
地区Region 区段1 Section 1 区段2 Section 2 区段3 Section 3 AAPC
(95% CI)/%P值
value年份
YearAPC
(95% CI)/%年份
YearAPC
(95% CI)/%年份
YearAPC
(95% CI)/%北京市Beijing 2004―2015 13.41(-30.12~47.65) 2015―2019 151.58 (124.29~204.81)① 2019―2021 -72.97(-80.39~-66.45)① 15.65 (1.23~34.88) 0.042 天津市Tianjin 2004―2015 -0.90(-50.02~17.46) 2015―2019 108.08(63.00~206.88)① 2019―2021 -76.08(-89.85~-62.33)① -0.17(-11.89~10.53) 0.942 河北省Hebei 2004―2016 11.60(2.73~18.57)① 2016―2019 68.31(43.68~91.54)① 2019―2021 -57.84(-68.41~-48.70)① 7.01(-2.99~11.42) <0.001 山西省Shanxi 2004―2012 48.99(9.50~102.72)① 2012―2019 13.86(1.44~27.81)① 2019―2021 -27.63(-62.84~40.93) 22.51(5.36~42.46) 0.008 内蒙古自治区Inner Mongolia 2004―2016 1.35(-11.75~16.40) 2016―2019 70.35(-54.60~539.15) 2019―2021 -46.66(-85.11~91.06) 3.00(-20.48~33.42) 0.823 辽宁省Liaoning 2004―2016 17.30(2.05~34.82)① 2016―2019 43.59(-38.82~237.00) 2019―2021 -43.07(-76.26~36.53) 11.64(-6.95~33.97) 0.236 吉林省Jilin 2004―2016 13.21(-9.98~160.62) 2016―2019 84.13(40.07~129.52)① 2019―2021 -68.51(-84.37~-49.78)① 6.12 (-3.59~37.03) 0.181 黑龙江省Heilongjiang 2004―2016 1.95(-27.81~22.95) 2016―2019 105.16(-43.54~195.03)① 2019―2021 -52.91(-76.55~-12.31)① 5.32(-6.12~20.90) 0.298 上海市Shanghai 2004―2016 14.24(1.19~28.97)① 2016―2019 85.46(-16.54~312.09) 2019―2021 -58.72(-79.35~-17.51)① 10.39(-6.10~29.78) 0.231 江苏省Jiangsu 2004―2016 1.66(-24.40~16.67) 2016―2019 172.02(97.44~289.11)① 2019―2021 -49.27(-69.34~-23.05)① 11.44(-3.53~22.33) 0.004 浙江省Zhejiang 2004―2016 7.66(-9.27~23.06) 2016―2019 295.60(220.92~415.00)① 2019―2021 -59.44(-68.80~-50.45)① 20.77(14.66~32.47) <0.001 安徽省Anhui 2004―2016 24.26(-2.46~39.06) 2016―2019 93.19(59.96~127.04)① 2019―2021 -49.78(-63.23~-35.23)① 20.74(14.42~30.20) <0.001 福建省Fujian 2004―2016 18.90(-39.12~352.01) 2016―2019 50.32(26.24~83.56)① 2019―2021 -48.75(-67.05~-25.96)① 12.24(2.24~38.43) 0.027 江西省Jiangxi 2004―2016 14.62(-0.28~22.41) 2016―2019 61.28(36.07~85.15)① 2019―2021 -37.05(-51.83~-19.56)① 13.45(9.15~18.62)① <0.001 山东省Shandong 2004―2016 13.06(-17.71~839.27) 2016―2019 92.54(44.15~147.30)① 2019―2021 -29.17(-52.15~-1.02)① 17.55(7.99~97.17) 0.002 河南省Henan 2004―2016 16.06(-19.74~37.41) 2016―2019 131.55(73.48~206.39)① 2019―2021 -48.51(-66.12~-29.21)① 19.15(9.71~33.42) <0.001 湖北省Hubei 2004―2016 6.71(-12.51~20.96) 2016―2019 208.05(150.19~293.63)① 2019―2021 -65.42(-74.64~-55.78)① 12.69(5.11~22.84) 0.008 湖南省Hunan 2004―2016 1.54(-24.74~22.62) 2016―2019 244.24(156.37~398.42)① 2019―2021 -53.85(-67.67~-40.57)① 14.80(4.07~30.12) 0.012 广东省Guangdong 2004―2016 23.59(-21.86~43.27) 2016―2019 111.33(71.06~160.18)① 2019―2021 -69.52(-81.49~-60.28)① 15.23(7.06~27.71) <0.001 广西壮族自治区Guangxi 2004―2015 -4.52(-35.87~11.63) 2015―2019 107.57(64.40~262.79)① 2019―2021 -35.47(-63.18~-3.01)① 9.46(3.17~20.14) 0.007 海南省Hainan 2004―2016 7.69(-22.12~30.47) 2016―2019 199.70(113.08~328.02)① 2019―2021 -44.67(-61.72~-27.81)① 19.29(11.14~35.75) <0.001 重庆市Chongqing 2004―2016 -7.32(-27.43~3.53) 2016―2019 195.64(98.58~399.56)① 2019―2021 -48.95(-67.46~-21.55)① 6.03(-1.45~14.72) 0.099 四川省Sichuan 2004―2016 -13.68(-43.86~0.56) 2016―2019 389.85(178.11~956.62)① 2019―2021 -37.81(-60.88~-12.32)① 12.83(6.10~25.11) <0.001 贵州省Guizhou 2004―2016 -6.29(-62.25~134.76) 2016―2019 59.01(-49.87~149.34) 2019―2021 -34.50(-74.49~55.97) -1.37(-11.19~12.65) 0.644 云南省Yunnan 2004―2016 -9.95(-35.09~1.88) 2016―2019 157.65(68.68~302.69)① 2019―2021 -38.84(-66.78~-0.49)① 3.57(-4.12~11.96) 0.298 西藏自治区Tibet 2004―2006 20.17(-39.84~166.69) 2006―2012 -41.74(-79.16~264.70) 2012―2021 45.80(0.53~160.36)① 3.10(-4.29~11.97) 0.284 陕西省Shaanxi 2004―2016 3.52(-26.08~33.76) 2016―2019 266.77(155.44~476.79)① 2019―2021 -67.93(-81.15~-56.55)① 12.75(1.54~34.33) 0.024 甘肃省Gansu 2004―2006 103.92 (-5.43~452.81) 2006―2019 9.27(-17.10~43.77) 2019―2021 -21.12(-47.08~15.55) 13.17(1.88~28.48) 0.015 青海省Qinghai 2004―2010 -7.81(-60.62~16.59) 2010―2019 37.28(30.78~73.88)① 2019―2021 -44.61(-62.68~-20.61)① 7.20(1.34~14.90) 0.020 宁夏回族自治区Ningxia 2004―2009 79.08(-37.35~639.96) 2009―2012 -21.35(-42.08~167.87) 2012―2021 4.55(-49.87~68.24) 16.48(5.36~40.06) 0.011 新疆维吾尔自治区Xinjiang 2004―2016 0.57(-19.66~11.99) 2016―2019 134.94(74.71~218.82)① 2019―2021 -71.65(-85.25~-57.77)① 0.65(-7.23~8.81) 0.830 全国Nationwide 2004―2016 11.54(-3.66~24.06) 2016―2019 147.06(100.71~205.07)① 2019―2021 -57.57(-69.51~-46.73)① 14.55(9.00~22.78) <0.001 注:AAPC,平均年度变化百分比。
①表示P值<0.05。
Note: AAPC, average annual percentage change.
① The P value<0.05.
下载: 导出CSV
表 3 中国各年龄组流行性感冒发病、死亡情况及发病率Joinpoint分析
Table 3. Incidence, death and incidence rate of influenza in different age groups in China
年龄组/岁
Age group/years发病和死亡情况
Incidence and mortality发病率变化趋势
Change trend of incidence rate病例数
Number of cases发病率
Incidence rate/100 000-1死亡数
Number of deaths死亡率
Mortality rate/100 000-1病死率
Case fatality rate/100 000-1AAPC
(95% CI)/%P值
value0~<1 324 636 115.72 18 0.006 5 5.54 23.80(15.60~32.58) <0.001 1~<2 487 038 158.51 20 0.006 7 4.11 22.37(11.09~34.80) <0.001 2~<3 504 477 162.61 29 0.009 3 5.75 12.04(12.45~30.28) <0.001 3~<4 584 040 194.18 19 0.006 5 3.25 24.69(16.28~33.72) <0.001 4~<5 524 714 191.19 25 0.009 1 4.76 23.33(14.48~32.87) <0.001 5~<6 475 220 170.50 10 0.003 5 2.10 22.08(11.84~33.25) <0.001 6~<7 506 379 182.85 14 0.005 3 2.76 20.83(9.94~32.79) <0.001 7~<8 498 740 172.01 8 0.002 9 1.60 18.36(6.74~31.26) 0.002 8~<9 369 264 124.21 8 0.002 8 2.17 15.18(-2.31~35.83) 0.093 9~<10 284 412 102.98 8 0.002 9 2.81 14.10(-7.78~41.17) 0.225 10~<15 903 191 64.98 16 0.001 2 1.77 8.61(-18.89~45.47) 0.579 15~<20 376 555 26.24 10 0.000 7 2.66 7.22(-24.96~53.21) 0.702 20~<25 245 749 14.29 15 0.000 8 6.10 10.56(-9.01~34.36) 0.313 25~<30 347 175 17.80 25 0.001 3 7.20 13.94(2.28~26.93) 0.018 30~<35 331 076 17.38 25 0.001 4 7.55 16.65(7.94~25.83) <0.001 35~<40 226 827 12.12 35 0.001 8 15.43 16.13(8.40~24.41) <0.001 40~<45 161 679 8.19 51 0.002 6 31.54 13.40(5.51~21.88) <0.001 45~<50 163 546 7.46 49 0.002 1 29.96 14.41(6.18~23.28) <0.001 50~<55 163 563 9.73 40 0.002 5 24.46 14.94(10.51~19.54) <0.001 55~<60 145 320 9.29 37 0.002 4 25.46 16.15(6.50~26.67) <0.001 60~<65 145 184 11.44 51 0.003 9 35.13 13.80(8.61~19.26) <0.001 65~<70 120 651 11.98 40 0.003 8 33.15 19.38(15.31~23.59) <0.001 70~<75 82 835 11.56 39 0.005 7 47.08 17.89(11.93~24.17) <0.001 75~<80 58 755 11.55 38 0.007 5 64.68 19.44(13.10~26.13) <0.001 80~<85 42 761 13.18 40 0.012 2 93.54 21.37(15.09~27.98) <0.001 ≥85 29 626 16.21 45 0.026 2 151.89 21.63(13.50~30.35) <0.001 注:AAPC,平均年度变化百分比。
Note: AAPC, average annual percentage change.
下载: 导出CSV
-
[1] Javanian M, Barary M, Ghebrehewet S, et al. A brief review of influenza virus infection[J]. J Med Virol, 2021, 93(8): 4638-4646. DOI: 10.1002/jmv.26990. [2] Naficy A, Kuxhausen A, Seifert H, et al. No immunological interference or concerns about safety when seasonal quadrivalent influenza vaccine is co-administered with a COVID-19 mRNA-1273 booster vaccine in adults: a randomized trial[J]. Hum Vaccin Immunother, 2024, 20(1): 2327736. DOI: 10.1080/21645515.2024.2327736. [3] Hagiya H, Osaki Y, Yamamoto M, et al. Global trends of seasonal influenza-associated mortality in 2001-2018: a longitudinal epidemiological study[J]. J Infect, 2023, 87(3): e54-e57. DOI: 10.1016/j.jinf.2023.06.011. [4] 郭子睿, 曹桂莹, 刘珏, 等. 基于Joinpoint回归模型分析2010-2019监测年度我国流感流行变化趋势[J]. 国际病毒学杂志, 2023, 30(2): 131-136. DOI: 10.3760/cma.j.issn.1673-4092.2023.02.009.Guo ZR, Cao GY, Liu J, et al. Joinpoint regression model based analysis of the trend of influenza epidemics in the surveillance years during 2010-2019 in China[J]. Int J Virol, 2023, 30(2): 131-136. DOI: 10.3760/cma.j.issn.1673-4092.2023.02.009. [5] Yu JS, Wen ZY, Hu WK, et al. Influenza D virus infection in China, 2022-2023[J]. Emerg Microbes Infect, 2024, 13(1): 2343907. DOI: 10.1080/22221751.2024.2343907. [6] Mossad SB. Influenza update 2018-2019: 100 years after the great pandemic[J]. Cleve Clin J Med, 2018, 85(11): 861-869. DOI: 10.3949/ccjm.85a.18095. [7] Jin YF, Yang HY, Ji WQ, et al. Virology, epidemiology, pathogenesis, and control of COVID-19[J]. Viruses, 2020, 12(4): 372. DOI: 10.3390/v12040372. [8] Si XH, Wang LP, Mengersen K, et al. Epidemiological features of seasonal influenza transmission among 11 climate zones in Chinese Mainland[J]. Infect Dis Poverty, 2024, 13(1): 4. DOI: 10.1186/s40249-024-01173-9. [9] Akin L, Gözel MG. Understanding dynamics of pandemics[J]. Turk J Med Sci, 2020, 50(SI-1): 515-519. DOI: 10.3906/sag-2004-133. [10] Ryu S, Cowling BJ. Human influenza epidemiology[J]. Cold Spring Harb Perspect Med, 2021, 11(12): a038356. DOI: 10.1101/cshperspect.a038356. [11] Li JL, Zhang YF, Zhang XL, et al. Influenza and universal vaccine research in China[J]. Viruses, 2022, 15(1): 116. DOI: 10.3390/v15010116. [12] Deng Y, Wang AL, Frasso R, et al. Mental health-related stigma and attitudes toward patient care among providers of mental health services in a rural Chinese county[J]. Int J Soc Psychiatry, 2022, 68(3): 610-618. DOI: 10.1177/0020764021992807. [13] Leal Neto O, Paolotti D, Dalton C, et al. Enabling multicentric participatory disease surveillance for global health enhancement: viewpoint on global flu view[J]. JMIR Public Health Surveill, 2023, 9: e46644. DOI: 10.2196/46644. [14] Wu HC, Xue M, Wu C, et al. Estimation of influenza incidence and analysis of epidemic characteristics from 2009 to 2022 in Zhejiang Province, China[J]. Front Public Health, 2023, 11: 1154944. DOI: 10.3389/fpubh.2023.1154944. [15] 陈宝, 丘美娇, 林尤斌, 等. SARIMA模型在海南某医院流感样病例预测中的可行性分析[J]. 南昌大学学报(医学版), 2022, 62(2): 75-78, 99. DOI: 10.13764/j.cnki.ncdm.2022.02.015.Chen B, Qiu MJ, Lin YB, et al. Feasibility of SARIMA model in predicting influenza-like illness cases in A tertiary hospital in Hainan[J]. Journal of Nanchang University (Medical Science), 2022, 62(2): 75-78, 99. DOI: 10.13764/j.cnki.ncdm.2022.02.015. [16] 刘先夺. 天津: 以务实举措持续强化医疗质量管理[J]. 中国卫生, 2024, (3): 30-31. DOI: 10.15973/j.cnki.cn11-3708/d.2024.03.011.Liu XD. Tianjin: continue to strengthen medical quality management with pragmatic measures[J]. China Health, 2024, (3): 30-31. DOI: 10.15973/j.cnki.cn11-3708/d.2024.03.011. [17] Ping KK, Lei MY, Gou Y, et al. Epidemiologic characteristics of COVID-19 in Guizhou Province, China[J]. J Infect Dev Ctries, 2021, 15(3): 389-397. DOI: 10.3855/jidc.12818. [18] Prezzi A, Saelens X, Vandijck D. Epidemiology of influenza over a ten-year period in Belgium: overview of the historical and current evidence[J]. Virol J, 2023, 20(1): 271. DOI: 10.1186/s12985-023-02238-1. [19] Hoy G, Kuan G, López R, et al. The spectrum of influenza in children[J]. Clin Infect Dis, 2023, 76(3): e1012-e1020. DOI: 10.1093/cid/ciac734. [20] Wu WY, Zheng XW, Ding H, et al. Association between combination COVID-19-influenza vaccination and long COVID in middle-aged and older Europeans: a cross-sectional study[J]. Hum Vaccin Immunother, 2024, 20(1): 2345505. DOI: 10.1080/21645515.2024.2345505. [21] Nair H, Abdullah Brooks W, Katz M, et al. Global burden of respiratory infections due to seasonal influenza in young children: a systematic review and meta-analysis[J]. Lancet, 2011, 378(9807): 1917-1930. DOI: 10.1016/S0140-6736(11)61051-9. [22] Villani L, D'Ambrosio F, Ricciardi R, et al. Seasonal influenza in children: costs for the health system and society in Europe[J]. Influenza Other Respir Viruses, 2022, 16(5): 820-831. DOI: 10.1111/irv.12991. -

 点击查看大图
计量
- 文章访问数: 13
- HTML全文浏览量: 10
- PDF下载量: 5
- 被引次数: 0