

Spatiotemporal patterns and epidemiological trends of scarlet fever epidemic in Yunnan Province from 2014 to 2023
-
摘要:
目的 分析2014―2023年云南省猩红热的流行趋势及时空分布特征,为猩红热防控策略提供科学依据。 方法 采用Joinpoint回归分析计算平均年度变化百分比,使用空间自相关与时空聚集性分析探讨云南省猩红热发病的时空分布特征。 结果 2014―2023年云南省猩红热发病率呈波浪上升趋势,累计报告猩红热患者18 210例,年均报告发病率为3.88/10万; 男性年均发病率均高于女性; 发病率最高的年龄组为5~<10岁年龄组(52.3%),其次为0~<5岁年龄组(37.3%); 97.7%的病例集中在托幼儿童(43.4%)、学生(31.9%)和散居儿童(22.5%); 猩红热发病率存在季节性(M=0.526~1.308),每年均呈双峰分布,即5―6月和11―12月; 年均发病率前3的州(市)为丽江市(11.07/10万)、玉溪市(7.61/10万)和大理白族自治州(6.43/10万)。2014―2023年云南省猩红热发病存在5个聚集区,主要集中在云南省西北部丽江市和大理市,云南省南部和西南部红河哈尼族彝族自治州、玉溪市和普洱市,云南省东部文山壮族苗族自治州、曲靖市及东北部昭通市; 2014―2023年云南省猩红热发病率不存在全局空间自相关(均P>0.05);局部自相关分析显示,“高-高”聚集区主要集中在云南省西北部丽江市宁蒗县和兰坪县、大理白族自治州永平县、玉溪市易门县和峨山县、曲靖市师宗县、昆明市禄劝县; “低-低”聚集区主要集中在云南省西部临沧市、大理白族自治州、楚雄彝族自治州、普洱市、西北迪庆藏族自治州部分地区、东部曲靖市部分地区、中部昆明市部分地区。 结论 2014―2023年云南省猩红热发病率呈上升趋势,托幼儿童和学生是发病的高危人群,发病存在空间聚集特征,应加强高发地区和重点人群的病例监测。 Abstract:Objective To analyze the epidemiological trend and distribution characteristics of scarlet fever in Yunnan Province from 2014 to 2023, and to provide scientific basis for scarlet fever prevention and control strategies. Methods Joinpoint regression analysis was used to calculate the annual percentage of change. And spatial autocorrelation and spatio-temporal aggregation analysis were used to explore the spatial and temporal distribution characteristics of scarlet fever in Yunnan Province. Results A total of 18 210 cases of scarlet fever were reported in Yunnan Province from 2014 to 2023, with an average annual incidence of 3.88/100 000. The incidence of scarlet fever in Yunnan Province showed a wave upward trend in the past 10 years. The incidence of male was higher than that of female. The age group with the highest incidence was 5- < 10 years old (52.3%), followed by 0- < 5 years old (37.3%). 97.7 % of the cases were concentrated in preschool children (43.4%), students (31.9%) and scattered children (22.5%). The incidence of scarlet fever had obvious seasonality (M=0.526-1.308), with a bimodal distribution every year, concentrated in May-June and November-December. The top three areas with the highest average annual incidence were Lijiang City (11.07/100 000), Yuxi City (7.61/100 000) and Dali Bai Autonomous Prefecture (6.43/100 000). The results of spatio-temporal scanning analysis showed that there were five clustering areas of scarlet fever in Yunnan Province from 2014 to 2023. The clustering areas were mainly concentrated in Lijiang City and Dali Prefecture in northwest Yunnan, Honghe Prefecture, Yuxi City and Pu ′er City in south and southwest Yunnan, Wenshan Prefecture, Qujing City in east Yunnan and some areas of Zhaotong City in northeast Yunnan. There was no global spatial autocorrelation in the incidence of scarlet fever in Yunnan Province from 2014 to 2023 (all P>0.05). The local autocorrelation analysis showed that the high-high clustering areas were mainly concentrated in Ninglang County and Lanping County of Lijiang City, Yongping County of Dali Prefecture, Yimen County and Eshan County of Yuxi City, Shizong County of Qujing City and Luquan County of Kunming City in the northwest of Yunnan Province. The low-low aggregation areas are mainly concentrated in Lincang City, Dali Prefecture, Chuxiong Prefecture, part of Pu′er City, part of Diqing Prefecture in Northwest Yunnan, part of Qujing City in East Yunnan, and part of Kunming City in Central Yunnan. Conclusions Scarlet fever in Yunnan Province showed an upward trend. Kindergarten children and students are the high-risk groups of the disease. The incidence of scarlet fever in Yunnan Province has spatial clustering characteristics. We should pay close attention to the changes of epidemic trends and strengthen the monitoring of cases in high-risk areas and High-risk groups. -

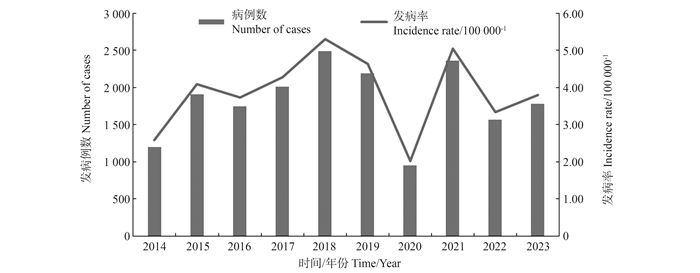
图 1 2014―2023年云南省报告猩红热发病例数和发病率
Figure 1. The number of cases and incidence rate of scarlet fever reported in Yunnan Province from 2014 to 2023

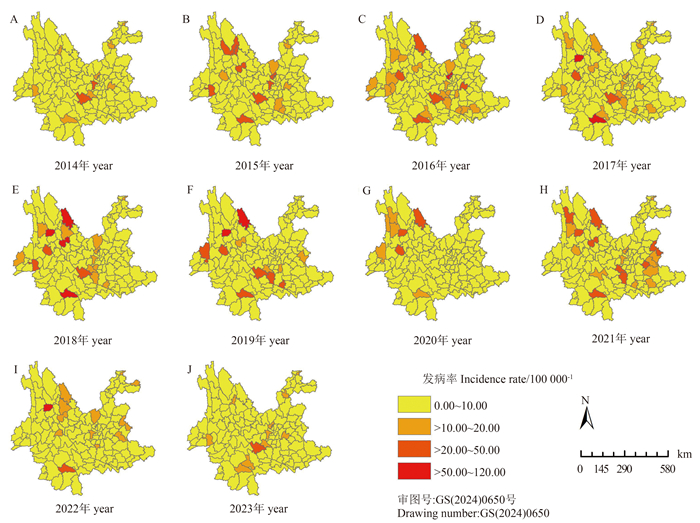
图 2 2014―2023年云南省各县(市、区)猩红热发病率分布情况
Figure 2. Distribution of scarlet fever incidence rate in counties of Yunnan Province from 2014 to 2023

图 3 2014―2023年云南省猩红热发病时空扫描聚集图
Figure 3. Spatio-temporal scan aggregation map of scarlet fever in Yunnan Province from 2014 to 2023

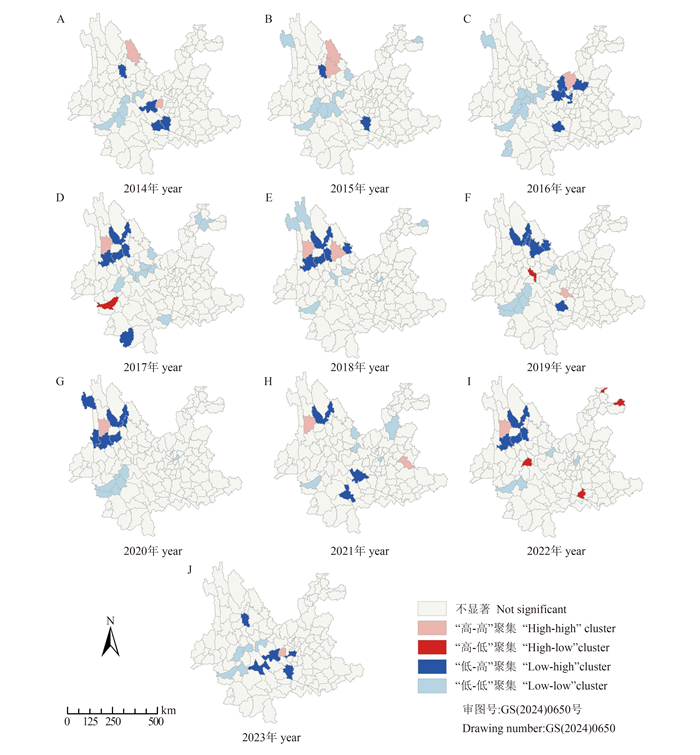
图 4 2014―2023年云南省猩红热发病率局部空间自相关指标聚集分布
Figure 4. Aggregation distribution of local spatial autocorrelation index of scarlet fever incidence rate in Yunnan Province from 2014 to 2023
表 1 2014―2023年云南省各州(市)猩红热发病率及均匀分布检验
Table 1. The incidence rate of scarlet fever and uniform distribution test in Yunnan Province from 2014 to 2023
地区
Region猩红热发病率The incidence rate of scarlet fever/100 000-1 P值
value2014 2015 2016 2017 2018 2019 2020 2021 2022 2023 昆明市Kunming City 3.52 4.38 5.89 2.81 3.26 2.13 0.56 2.39 1.63 1.94 0.001 曲靖市Qujing City 1.64 2.38 1.87 1.82 1.83 4.00 1.46 5.78 3.92 2.36 0.085 玉溪市Yuxi City 5.80 9.64 9.15 9.26 11.26 10.77 1.72 8.06 5.51 4.92 0.332 保山市Baoshan City 5.37 5.69 5.66 8.36 8.15 5.86 2.89 3.08 4.34 6.80 0.569 昭通市Zhaotong City 1.63 2.18 1.92 1.64 1.59 1.56 1.01 2.00 2.02 1.17 0.482 丽江市Lijiang City 6.29 15.39 5.86 5.91 17.52 18.60 8.45 11.80 5.72 15.19 0.739 普洱市Pu′er City 2.69 4.82 4.18 8.44 9.36 4.82 2.26 10.77 5.00 6.84 0.406 临沧市Lincang City 0.24 0.52 0.48 1.31 0.75 0.28 0.20 0.22 0.18 0.58 0.300 楚雄彝族自治州Chuxiong Prefecture 1.02 0.97 1.43 0.69 1.49 1.38 0.80 1.45 0.67 0.59 0.591 红河哈尼族彝族自治州Honghe Prefecture 2.11 5.13 4.41 4.63 5.11 7.99 2.35 7.59 3.15 3.56 0.759 文山壮族苗族自治州Wenshan Prefecture 1.25 1.80 1.66 2.71 1.98 2.11 1.25 6.11 4.07 3.91 0.002 西双版纳州Xishuangbanna Prefecture 0.17 0.26 0.26 1.71 1.44 1.77 0.17 1.08 0.93 0.69 0.805 大理白族自治州Dali Prefecture 2.28 5.64 3.72 8.75 13.81 6.46 4.01 5.51 6.32 7.84 0.426 德宏傣族景颇族自治州Dehong Prefecture 1.70 2.66 4.22 3.04 7.79 3.04 1.96 2.58 2.21 3.71 0.984 怒江傈僳族自治州Nujiang Prefecture 0.37 1.64 6.80 4.13 4.94 3.07 9.16 4.89 2.73 3.30 0.834 迪庆藏族自治州Diqing Prefecture 1.96 0.97 0.74 5.99 0 1.93 5.50 15.23 2.86 3.84 0.114  下载: 导出CSV
表 2 2014―2023年云南省猩红热发病率集中度值
Table 2. Concentration value of scarlet fever incidence rate in Yunnan Province from 2014 to 2023
年份Year Rx Ry M 2014 0.650 -0.151 0.667 2015 0.984 -0.861 1.294 2016 0.369 -0.683 0.776 2017 0.443 -0.616 0.812 2018 0.820 -0.771 1.013 2019 0.375 -0.529 0.664 2020 -0.474 0.228 0.526 2021 0.539 -0.626 0.826 2022 0.367 -0.442 0.574 2023 -0.391 -0.361 0.607 注:M, 集中度; R, 离散度。
Note: M, concentration, R, dispersion.
下载: 导出CSV
表 3 2014―2023年云南省猩红热时空扫描分析
Table 3. Spatio-temporal scan analysis of scarlet fever in Yunnan Province from 2014 to 2023
聚集区
Clusters detected中心点
Coordinates半径
Radius/km聚集时间/年
Time frame/year聚集地区数
Number of agglomerations实际病例数
Actual number of cases理论病例数
Expected casesRR值
valueLLR值
valueP值
value1 26.687 766N, 100.749 742E 96.71 km 2016―2019 8 1 512 310.86 5.21 1 231.86 < 0.001 2 23.434 743N, 101.690 555E 117.81 km 2018―2021 13 1 779 526.77 3.63 958.30 < 0.001 3 24.535 070N, 103.763 981E 67.34 km 2014―2017 7 968 485.14 2.05 192.47 < 0.001 4 23.708 484N, 102.494 623E 77.82 km 2014―2015 13 490 307.04 1.61 47.02 < 0.001 5 34.254 093N, 117.246 281E 1 366.08 km 2014―2015 3 86 48.46 1.78 11.83 0.012
下载: 导出CSV
表 4 2014―2023年云南省猩红热发病率全局空间自相关分析
Table 4. Global spatial autocorrelation analysis of scarlet fever incidence rate in Yunnan Province from 2014 to 2023
年份
Year莫兰指数
Moran′s IZ值
valueP值
value聚集
Aggregation2014 0.02 0.51 0.61 否No 2015 0.02 0.47 0.64 否No 2016 -0.02 -0.22 0.83 否No 2017 -0.01 0.03 0.97 否No 2018 -0.01 -0.03 0.98 否No 2019 0.01 0.45 0.66 否No 2020 0.04 0.98 0.33 否No 2021 0.00 0.16 0.87 否No 2022 -0.02 -0.37 0.71 否No 2023 0.03 0.66 0.51 否No
下载: 导出CSV
-
[1] 李兰娟, 任红. 传染病学[M]. 第9版. 北京: 人民卫生出版社, 2018: 203-207.Li LJ, Ren H. Infectious diseases[M]. 9th Edition. Beijing: People's Medical Publishing House, 2018: 203-207. [2] 廖如珺, 刘润友, 杨长虹. 四川省2009—2018年猩红热流行病学分析[J]. 传染病信息, 2019, 32(4): 322-324, 328. DOI: 10.3969/j.issn.1007-8134.2019.04.008.Liao RJ, Liu RY, Yang CH. Epidemiological analysis of scarlet fever in Sichuan Province from 2009 to 2018[J]. Infect Dis Inf, 2019, 32(4): 322-324, 328. DOI: 10.3969/j.issn.1007-8134.2019.04.008. [3] You Y, Qin Y, Walker MJ, et al. Increased incidence of scarlet fever-China, 1999-2018[J]. China CDC Wkly, 2019, 1(5): 63-66. [4] 张佳豪, 杨若男, 贺舒凝, 等. 2016—2020年中国猩红热发病的空间聚集性分析[J]. 南方医科大学学报, 2023, 43(4): 644-648. DOI: 10.12122/j.issn.1673-4254.2023.04.19.Zhang JH, Yang RN, He SN, et al. Spatial clustering analysis of scarlet fever incidence in China from 2016 to 2020[J]. J South Med Univ, 2023, 43(4): 644-648. DOI: 10.12122/j.issn.1673-4254.2023.04.19. [5] 中华人民共和国卫生部. 猩红热诊断标准: WS 282—2008[S]. 北京: 人民卫生出版社, 2008: 1-2.Ministry of Health of the People's Republic of China. Diagnostic criteria for scarlet fever: WS 282—2008[S]. Beijing: People's Medical Publishing House, 2008: 1-2. [6] 陈莉华, 念鹏英, 沈秀莲, 等. 云南省2013—2022年登革热流行趋势及暴发疫情特征分析[J]. 中国媒介生物学及控制杂志, 2024, 35(1): 63-68. DOI: 10.11853/j.issn.1003.8280.2024.01.011.Chen LH, Nian PY, Shen XL, et al. Epidemiological trends and outbreak characteristics of dengue fever in Yunnan Province, China, 2013-2022[J]. Chin J Vector Biol Control, 2024, 35(1): 63-68. DOI: 10.11853/j.issn.1003.8280.2024.01.011. [7] Bao YJ, Li YX, Zhou YB, et al. Global burden associated with rare infectious diseases of poverty in 2021: findings from the global burden of disease study 2021[J]. Infect Dis Poverty, 2024, 13(1): 85. DOI: 10.1186/s40249-024-01249-6. [8] Zhou Y, Tao MY, Lu ZJ, et al. Epidemiological characteristics and spatiotemporal clustering of hepatitis A in Zhejiang Province from 2010 to 2019[J]. Chin J Prev Med, 2022, 56(4): 459-463. DOI: 10.3760/cma.j.cn112150-20210406-00330. [9] 张志杰, 姜庆五. 空间流行病学[M]. 北京: 高等教育出版社, 2020: 195-203.Zhang ZJ, Jiang QW. Space epidemiology[M]. Beijing: Higher Education Press, 2020: 195-203. [10] 郑泽扬, 王众楷, 王连珂, 等. 2004—2018年中国主要呼吸道传染病的流行趋势及特征[J]. 中华疾病控制杂志, 2022, 26(6): 624-630. DOI: 10.16462/j.cnki.zhjbkz.2022.06.002.Zheng ZY, Wang ZK, Wang LK, et al. Epidemiological trends and characteristics of major respiratory infectious diseases in China from 2004 to 2018[J]. Chin J Dis Control Prev, 2022, 26(6): 624-630. DOI: 10.16462/j.cnki.zhjbkz.2022.06.002. [11] He F, Zhang YT, Zhu BQ, et al. Epidemiological characteristics of scarlet fever in Hubei Province from 2009 to 2018[J]. Chin J Prev Med, 2020, 54(5): 568-571. DOI: 10.3760/cma.j.cn112150-20190509-00378. [12] You Y, Davies MR, Protani M, et al. Scarlet fever epidemic in China caused by streptococcus pyogenes serotype M12: epidemiologic and molecular analysis[J]. EBioMedicine, 2018, 28: 128-135. DOI: 10.1016/j.ebiom.2018.01.010. [13] 刘妍琛. 兰州市气象因素、大气污染物及其交互作用与儿童猩红热发病的关联性研究[D]. 兰州: 兰州大学, 2022.Liu YC. Study on the correlation between meteorological factors, atmospheric pollutants and their interaction with the incidence of scarlet fever in children in Lanzhou[D]. Lanzhou: Lanzhou University, 2022. [14] Liu YH, Ding H, Chang ST, et al. Exposure to air pollution and scarlet fever resurgence in China: a six-year surveillance study[J]. Nat Commun, 2020, 11(1): 4229. DOI: 10.1038/s41467-020-17987-8. [15] 罗雅楠, 程云飞, 郑晓瑛. "全面二孩"政策后我国人口态势趋势变动[J]. 人口与发展, 2016, 22(5): 2-14. DOI: 10.3969/j.issn.1674-1668.2016.05.001.Luo YN, Cheng YF, Zheng XY. Future population development trend after "two-child policy"[J]. Population and Development, 2016, 22(5): 2-14. DOI: 10.3969/j.issn.1674-1668.2016.05.001. [16] Li C, Liao RJ, Zhu WH, et al. Spatiotemporal dynamics and potential ecological drivers of acute respiratory infectious diseases: an example of scarlet fever in Sichuan Province[J]. BMC Public Health, 2022, 22(1): 2139. DOI: 10.1186/s12889-022-14469-y. [17] Lu JY, Chen ZQ, Liu YH, et al. Effect of meteorological factors on scarlet fever incidence in Guangzhou City, Southern China, 2006-2017[J]. Sci Total Environ, 2019: 227-235. DOI: 10.1016/j.scitotenv.2019.01.318 [18] Li DH, Liu YC, Zhang W, et al. The association between the scarlet fever and meteorological factors, air pollutants and their interactions in children in northwest China[J]. Int J Biometeorol, 2024, 68(10): 1989-2002. DOI: 10.1007/s00484-024-02722-5. [19] Zhang R, Zhang YH. Modeling the effects of air pollutants and meteorological factors on scarlet fever in five provinces, Northwest China, 2013-2018[J]. J Theor Biol, 2022, 544: 111134. DOI: 10.1016/j.jtbi.2022.111134. [20] Rao HX, Li DM, Zhao XY, et al. Spatiotemporal clustering and meteorological factors affected scarlet fever incidence in mainland China from 2004 to 2017[J]. Sci Total Environ, 2021, 777: 146145. DOI: 10.1016/j.scitotenv.2021.146145. [21] 王乙, 王哲, 金新叶, 等. 2010―2023年杭州市猩红热流行病学特征及时空聚集性分析[J]. 中华疾病控制杂志, 2024, 28(8): 950-955. DOI: 10.16462/j.cnki.zhjbkz.2024.08.013.Wang Y, Wang Z, Jin XY, et al. Epidemiological characteristics and spatial-temporal clustering of scarlet fever in Hangzhou from 2010 to 2023[J]. Chin J Dis Control Prev, 2024, 28(8): 950-955. DOI: 10.16462/j.cnki.zhjbkz.2024.08.013. [22] 马涛, 洪镭, 杜雪飞, 等. 2014―2019年南京市猩红热流行特征和时空聚集性[J]. 中华疾病控制杂志, 2021, 25(3): 346-351. DOI: 10.16462/j.cnki.zhjbkz.2021.03.018.Ma T, Hong L, Du XF, et al. Epidemiological characteristics and temporal-spatial clustering of scarlet fever in Nanjing from 2014 to 2019[J]. Chin J Dis Control Prev, 2021, 25(3): 346-351. DOI: 10.16462/j.cnki.zhjbkz.2021.03.018. -

 点击查看大图
计量
- 文章访问数: 14
- HTML全文浏览量: 7
- PDF下载量: 3
- 被引次数: 0