

-
摘要:
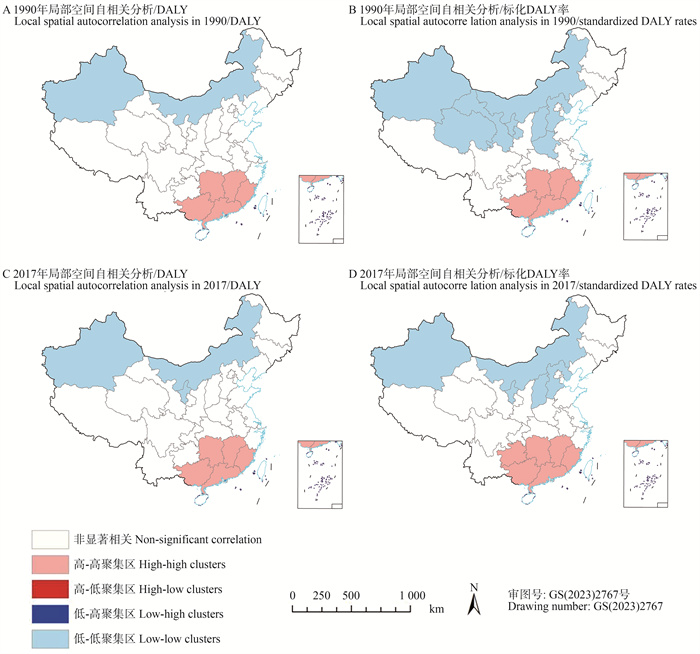
目的 分析中国鼻咽癌的疾病负担及公平性,为科学防治提供依据。 方法 利用2017年全球疾病负担数据,以省级行政区为单位, 利用空间自相关分析鼻咽癌疾病负担的空间分布,利用斜率指数(slope index, SI)和集中指数(concentration index, CI)分析鼻咽癌疾病负担的公平性。 结果 1990和2017年高-高聚集区主要集中在南方,低-低聚集区主要集中在北方,呈南高北低的分布特点。和1990年相比,2017年鼻咽癌的伤残调整寿命年(disability adjusted life year, DALY)总体下降11.20%、标化DALY率下降24.80%,但澳门、陕西和新疆等地上升。1990年DALY和标化DALY率的SI为-34.71、-6.00,CI为-0.08、0.14;2017年DALY和标化DALY率的SI为9.74、12.46,CI为0.07、0.04。 结论 相比1990年,2017年中国鼻咽癌疾病负担有所下降,但各地分布不平衡,存在不平等现象,且仍有一些地区疾病负担上升,应重点关注高疾病负担聚集区和出现上升的地区,改善鼻咽癌疾病负担的不公平性。 Abstract:Objective To analyze the disease burden and equity of nasopharyngeal carcinoma (NPC) in China and provide a scientific basis for prevention and treatment. Methods Using the 2017 Global Burden of Disease Study, the spatial distribution of the disease burden of NPC was analyzed using spatial autocorrelation in province-level division units, and the equity of the disease burden of NPC was analyzed by slope index (SI) and concentration index (CI). Results In 1990 and 2017, the high-high concentration areas were mainly in the south, while the low-low concentration areas were mainly in the north, showing the distribution characteristics of high disease burden in the south and low disease burden in the north. Compared to 1990, the disability adjusted life year (DALY) of NPC decreased by 11.20% overall, and standardized DALY rate decreased by 24.80% in 2017. However, the disease burden of NPC has increased in several regions such as Macau, Shaanxi and Xinjiang. In 1990, the SI of DALY and standardized DALY rate were -34.71 and -6.00, respectively. The CI were -0.08 and 0.14. In 2017, the SI were 9.74 and 12.46, and the CI were 0.07 and 0.04. Conclusions Compared to 1990, the disease burden of NPC in China has decreased in 2017. However, there is a significant imbalance in its distribution, and there are health inequalities. In some regions, the disease burden has actually increased. Therefore, it is crucial to prioritize areas with high disease burden and those experiencing a rise in disease burden. This will help address the unfairness associated with the disease burden of NPC. -
Key words:
- Nasopharyngeal carcinoma /
- Spatial autocorrelation /
- Fairness
-

图 1 1990和2017年中国鼻咽癌疾病负担局部空间自相关分析
DALY, 伤残调整寿命年。
Figure 1. Local spatial autocorrelation analysis of the disease burden of nasopharyngeal carcinoma in China in 1990 and 2017
DALY, disability adjusted life year.

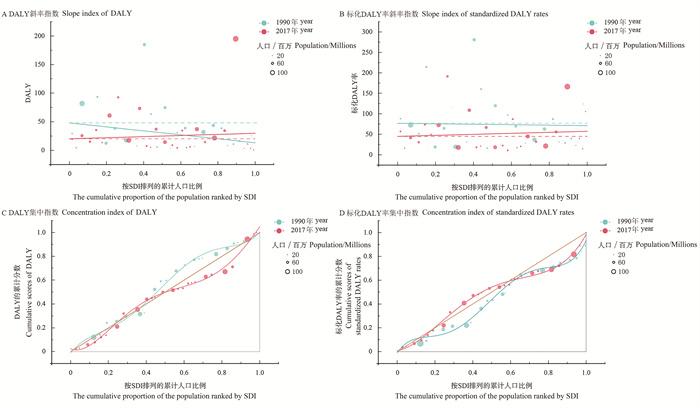
图 2 1990和2017年中国鼻咽癌DALY和标化DALY率基于斜率指数和集中指数的公平性分析
SDI: 社会人口指数;DALY: 伤残调整寿命年。
Figure 2. Fairness analysis of DALY and standardized DALY rates for nasopharyngeal carcinoma in China in 1990 and 2017 based on slope index and concentration index
SDI: socio-demographic index; DALY: disability adjusted life year.
表 1 1990和2017年中国鼻咽癌DALY、标化DALY率及变化情况
Table 1. DALY, standardized DALY rates, and changes in nasopharyngeal carcinoma in China in 1990 and 2017
中国自然地理区划
Physical geography division of China地区Area DALY/千人年DALY/thousand person year 标化DALY率/人年·10万-1
Standardized DALY rate /person year·100 000-11990年year 2017年year 变化率/% Rate of change/% 1990年year 2017年year 变化率/% Rate of change/% 中国China 920.00 817.00 -11.20 76.87 57.81 -24.80 华北North China 北京Beijing 3.50 3.51 0.29 31.18 14.56 -53.30 天津Tianjin 3.32 3.51 5.72 36.14 22.99 -36.39 河北Hebei 12.20 14.20 16.39 19.23 18.56 -3.48 山西Shanxi 6.43 4.24 -34.06 21.24 10.97 -48.35 内蒙古Inner Mongolia 6.40 4.52 -29.38 28.13 17.44 -38.00 东北Northeast China 辽宁Liaoning 16.20 14.30 -11.73 39.83 31.94 -19.81 吉林Jilin 8.15 5.69 -30.18 31.41 20.39 -35.08 黑龙江Heilongjiang 10.60 8.87 -16.32 29.08 22.60 -22.28 华东East China 上海Shanghai 9.65 11.00 13.99 69.03 39.34 -43.01 江苏Jiangsu 43.40 36.90 -14.98 63.09 45.19 -28.37 浙江Zhejiang 38.50 34.20 -11.17 87.36 55.97 -35.93 安徽Anhui 38.40 25.60 -33.33 64.77 41.81 -35.45 福建Fujian 30.90 34.40 11.33 97.52 87.39 -10.39 江西Jiangxi 63.50 35.30 -44.41 160.53 74.18 -53.79 山东Shandong 31.70 21.40 -32.49 37.08 21.57 -41.83 华中Central China 河南Henan 17.20 17.30 0.58 19.49 18.00 -7.64 湖北Hubei 38.70 36.90 -4.65 69.71 66.79 -4.19 湖南Hunan 74.60 73.10 -2.01 119.99 108.91 -9.23 华南South China 广东Guangdong 1 850.00 195.00 5.41 281.08 166.52 -40.76 广西Guangxi 93.40 92.60 -0.86 214.68 191.65 -10.73 海南Hainan 12.30 11.20 -8.94 177.00 116.42 -34.23 西南Southwest China 重庆Chongqing 14.80 13.30 -10.14 93.49 49.94 -46.58 四川Sichuan 81.70 60.80 -25.58 73.21 72.88 -0.45 贵州Guizhou 29.30 19.30 -34.13 88.31 57.07 -35.38 云南Yunnan 20.20 15.10 -25.25 51.75 30.65 -40.77 西藏Tibet 0.16 0.12 -23.08 6.71 3.46 -48.44 西北Northwest China 陕西Shaanxi 5.61 7.30 30.12 16.29 18.48 13.44 甘肃Gansu 7.47 4.35 -41.77 31.58 16.38 -48.13 青海Qinghai 1.25 1.13 -9.60 26.40 18.05 -31.63 宁夏Ningxia 1.52 1.38 -9.21 30.86 19.63 -36.39 新疆Xinjiang 4.12 5.20 26.21 26.09 21.36 -18.13 港澳台Hong Kong, Macao and Taiwan 台湾Taiwan 25.30 24.90 -1.58 124.12 105.69 -14.85 香港Hong Kong 9.60 4.68 -51.25 166.52 62.37 -62.55 澳门Macao 0.34 0.50 48.07 94.83 72.94 -23.08 注:DALY, 伤残调整寿命年。
Note:DALY, disability adjusted life year. 下载: 导出CSV
表 2 1990和2017年中国鼻咽癌DALY和标化DALY率的全局空间自相关分析结果
Table 2. Results of global spatial autocorrelation analysisis of nasopharyngeal cancer DALY and standardized DALY rates in China in 1990 and 2017
指标Indicator 年份Year Moran′s I Z值value P值value 聚集
AggregationDALY/千人年DALY/thousand person year 1990 0.30 3.52 <0.001 是Yes 2017 0.25 3.32 <0.001 是Yes 标化DALY率/人年·10万-1 Standardized DALY rate/person year·100 000-1 1990 0.61 6.15 <0.001 是Yes 2017 0.53 5.42 <0.001 是Yes 注:DALY, 伤残调整寿命年。
Note:DALY, disability adjusted life year.
下载: 导出CSV
表 3 1990和2017年中国鼻咽癌DALY和标化DALY率的健康不平等指数
Table 3. Health inequality index of nasopharyngeal cancer DALY and standardized DALY rates in China in 1990 and 2017
指标Indicator 健康不平等指数
Health inequality index年份Year 数值Number DALY/千人年DALY/thousand person year 斜率指数Slope index 1990 -34.71 2017 9.74 集中指数Concentration index 1990 -0.08 2017 0.07 标化DALY率/人年·10万-1 Standardized DALY rate/person year·100 000-1 斜率指数Slope index 1990 -6.00 2017 12.46 集中指数Concentration index 1990 0.14 2017 0.04 注:DALY, 伤残调整寿命年。
Note:DALY, disability adjusted life year.
下载: 导出CSV
-
[1] Song YX, Cheng WW, Li HQ, et al. The global, regional, national burden of nasopharyngeal cancer and its attributable risk factors (1990-2019) and predictions to 2035[J]. Cancer Med, 2022, 11(22): 4310-4320. DOI: 10.1002/cam4.4783. [2] Sung H, Ferlay J, Siegel RL, et al. Global cancer statistics 2020: GLOBOCAN estimates of incidence and mortality worldwide for 36 cancers in 185 countries[J]. CA Cancer J Clin, 2021, 71(3): 209-249. DOI: 10.3322/caac.21660. [3] Zhang RH, He YF, Wei BC, et al. Nasopharyngeal carcinoma burden and its attributable risk factors in China: estimates and forecasts from 1990 to 2050[J]. Int J Environ Res Public Health, 2023, 20(4): 2926. DOI: 10.3390/ijerph20042926. [4] Organization WH. Handbook on health inequality monitoring with a special focus on low- and middle-income countries[M]. Geneva: WHO press, 2013: 6-55. [5] Yang D, Bin NF, Zhou ZY, et al. Demographics and economic burden of nasopharyngeal carcinoma inpatients[J]. Biomed Res Int, 2022, 2022: 6958806. DOI: 10.1155/2022/6958806. [6] Zhou MG, Wang HD, Zeng XY, et al. Mortality, morbidity, and risk factors in China and its provinces, 1990-2017: a systematic analysis for the Global Burden of Disease Study 2017[J]. Lancet, 2019, 394(10204): 1145-1158. DOI: 10.1016/S0140-6736(19)30427-1. [7] GBD 2017 Risk Factor Collaborators. Global, regional, and national comparative risk assessment of 84 behavioural, environmental and occupational, and metabolic risks or clusters of risks for 195 countries and territories, 1990-2017: a systematic analysis for the Global Burden of Disease Study 2017[J]. Lancet, 2018, 392(10159): 1923-1994. DOI: 10.1016/S0140-6736(18)32225-6. [8] GBD 2015 DALYs and HALE Collaborators. Global, regional, and national disability-adjusted life-years (DALYs) for 315 diseases and injuries and healthy life expectancy (HALE), 1990-2015: a systematic analysis for the Global Burden of Disease Study 2015[J]. Lancet, 2016, 388(10053): 1603-1658. DOI: 10.1016/S0140-6736(16)31460-X. [9] 刘岩. 河南省肺癌时空分布特征及环境因素影响研究[D]. 郑州: 郑州大学, 2022: 24-25.Liu Y. Study on the spatio-temporal distribution of lung cancer and the influence of environmental factors in Henan province[D]. Zhengzhou: Zhengzhou University, 2022: 24-25. [10] 宋宁娟, 谢昀, 丁晟, 等. 江西省2013—2018年肾综合征出血热空间自相关分析[J]. 中华疾病控制杂志, 2020, 24(8): 876-880. DOI: 10.16462/j.cnki.zhjbkz.2020.08.003.Song NJ, Xie Y, Ding S, et al. Spatial autocorrelation analysis of hemorrhagic fever with renal syndrome in Jiangxi province from 2013 to 2018[J]. Chin J Dis Control Prev, 2020, 24(8): 876-880. DOI: 10.16462/j.cnki.zhjbkz.2020.08.003. [11] Hyldgard VB, Johnsen SP, Sogaard R. Index-based inequality in quality of care: an empirical comparison of apples and pears[J]. Clin Epidemiol, 2021, 13: 791-800. DOI: 10.2147/CLEP.S311813. [12] Cao F, He YS, Wang Y, et al. Global burden and cross-country inequalities in autoimmune diseases from 1990 to 2019[J]. Autoimmun Rev, 2023, 22(6): 103326. DOI: 10.1016/j.autrev.2023.103326. [13] 高忠飞. 宁夏医改项目县农村居民卫生服务公平性动态变化研究[D]. 银川: 宁夏医科大学, 2017: 5-6.Gao ZF. Study on dynamic change of health service equity of rural residents in Ningxia medical reform project counties[D]. Yinchuan: Ningxia Medical University, 2017: 5-6. [14] 徐媛媛, 曾新颖, 邱琇, 等. 中国儿童青少年缺铁性贫血疾病负担及健康公平性分析[J]. 中国妇幼健康研究, 2021, 32(6): 830-837. DOI: 10.3969/j.issn.1673-5293.2021.06.011.Xu YY, Zeng XY, Qiu X, et al. Analysis on disease burden and health equity of iron-deficiency anemia among children and adolescents in China[J]. Chinese Journal of Woman and Child Health Research, 2021, 32(6): 830-837. DOI: 10.3969/j.issn.1673-5293.2021.06.011. [15] Yu H, Yin X, Mao Y, et al. The global burden of nasopharyngeal carcinoma from 2009 to 2019: an observational study based on the Global Burden of Disease Study 2019[J]. Eur Arch Otorhinolaryngol, 2022, 279(3): 1519-1533. DOI: 10.1007/s00405-021-06922-2. [16] 梁宇卿, 陈宏达, 喻达. 恶性肿瘤防治规划和防治策略的经验借鉴[J]. 癌症进展, 2021, 19(17): 1736-1739. DOI: 10.11877/j.issn.1672-1535.2021.19.17.03.Liang YQ, Chen HD, Yu D. The experience of planning and strategy for prevention and treatment of malignant tumor[J]. Cancer progression, 2021, 19(17): 1736-1739. DOI: 10.11877/j.issn.1672-1535.2021.19.17.03. -

 点击查看大图
计量
- 文章访问数: 109
- HTML全文浏览量: 46
- PDF下载量: 16
- 被引次数: 0