

Analysis of the mediating relationship between socioeconomic in gender and frailty in middle-aged and older adults
-
摘要:
目的 探究社会经济地位(socioeconomic status, SES)在性别与衰弱间的中介效应,为预防衰弱提供依据。 方法 基于2018年中国健康与养老追踪调查(China Health and Retirement Longitudinal Study, CHARLS)≥45岁受访者数据,采用χ2检验分析不同特征个体的衰弱检出情况,采用Bootstrap法的中介效应模型验证SES在性别与衰弱关系中的作用。 结果 ≥45岁中老年群体衰弱检出率为34.70%,且女性(37.59%)高于男性(30.57%)(χ2=34.672, P < 0.001)。控制年龄、婚姻状况、居住地后,女性衰弱风险高于男性(OR=1.318, 95% CI: 1.181~1.470, P < 0.001);女性SES水平低于男性(β=-1.282, P < 0.001);SES与衰弱呈负相关(OR=0.928, 95% CI: 0.916~0.948, P < 0.001)。Bootstrap法检验结果表明,SES对衰弱的间接效应(natural indirect effect, NIE)为0.056(95% CI: 0.040~0.073, P < 0.001),占总效应的25.5%。 结论 我国中老年群体衰弱问题严峻,SES在性别与衰弱间起部分中介作用,衰弱防治策略应重视不同SES梯度下的性别差异。 Abstract:Objective To explore the mediating effect of socioeconomic status (SES) between gender and frailty, and to provide further prevention of frailty. Methods Older adults aged 45 years and above in the 2018 China Health and Retirement Longitudinal Study(CHARLS) were selected, the χ2 test was used to analyze the detection of frailty in older adults with different characteristics, and the mediating effect model using the Bootstrap method was used to validate the role of SES in the relationship between gender and frailty. Results The detection rate of frailty in middle-aged and older adults aged 45 years and above was 34.70%, and it was higher in women (37.59%) than in men (30.57%) (χ2 =34.672, P < 0.001). After controlling for age, marital status, and residence, women had a higher risk of frailty than men (OR=1.318, 95% CI: 1.181-1.470, P < 0.001); women had lower SES levels than men (β=-1.282, P < 0.001); and SES was negatively associated with frailty (OR=0.928, 95% CI: 0.916-0.948, P < 0.001). Bootstrap test showed that the natural indirect effect (NIE) of SES on frailty was 0.056 (95 % CI: 0.040-0.073, P < 0.001), accounting for 25.5% of the total effect. Conclusions SES has a mediating effect between gender and frailty, and the prevention and treatment of frailty should be tailored to the characteristics of SES in individuals of different genders. -
Key words:
- Frailty /
- Gender /
- Socioecomic Status /
- Mediation effect
-

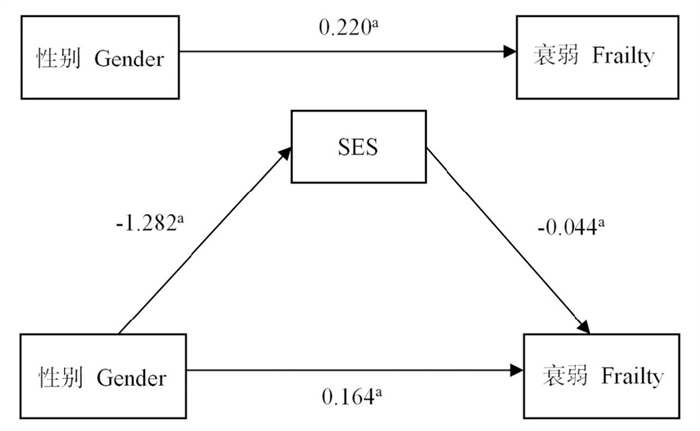
图 1 M(SES)在X(性别)与Y(衰弱)关系中的中介效应
SES:社会经济地位;a:P < 0.001。
Figure 1. Mediating effect of M (SES) in the relationship between X (gender) and Y (frailty)
SES: socioeconomic status; a: P < 0.001.
表 1 不同特征研究对象衰弱检出率比较
Table 1. Comparison of frailty detection rates among respondents with different characteristics
变量
Variable总体
Total① (n=6 561)衰弱 Frailty① χ2值
valueP值
value无 No
(n=4 286)有 Yes
(n=2 275)年龄组/岁 Age group/years 125.479 < 0.001 45~ < 55 1 397(21.3) 1 054(75.4) 343(24.6) 55~ < 65 2 218(33.8) 1 502(67.7) 716(32.3) ≥65 2 946(44.9) 1 730(58.7) 1 216(41.3) 性别 Gender 34.672 < 0.001 男性 Male 2 722(41.5) 1 890(69.4) 832(30.6) 女性 Female 3 839(58.5) 2 396(62.4) 1 443(37.6) 婚姻状况 Marital status 63.661 < 0.001 在婚 Married 5 526(84.2) 3 722(67.4) 1 804(32.6) 非在婚 Unmarried 1 035(15.8) 564(54.5) 471(45.5) 居住地 Residence 12.918 < 0.001 农村 Rural 4 756(72.5) 3 045(64.0) 1 711(36.0) 城镇 Urban 1 805(27.5) 1 241(68.8) 564(31.2) 教育程度 Education level 93.873 < 0.001 文盲 Illiterate 1 423(21.7) 805(56.6) 618(43.4) 小学 Primary school 3 092(47.1) 2 014(65.1) 1 078(34.9) 初中 Middle school 1 332(20.3) 929(69.7) 403(30.3) 高中 High school 615(9.4) 459(74.6) 156(25.4) 专科 Specialized training school 55(0.8) 41(74.5) 14(25.5) 本科及以上 College and above 44(0.7) 38(86.4) 6(13.6) 职业 Occupation 132.399 < 0.001 政府部门 Government 140(2.1) 112(80.0) 28(20.0) 事业单位 Public institution 919(14.0) 627(68.2) 292(31.8) 企业 Firm 216(3.3) 177(81.9) 39(18.1) 个体户 Individual firm 456(7.0) 359(78.7) 97(21.3) 农业 Farmer 3 880(59.1) 2 399(61.8) 1 481(38.2) 无职业 Occupation-free 950(14.5) 612(64.4) 338(35.6) 个人年收入/元 Annual personal income/yuan 141.697 < 0.001 < 5 000 2 551(38.9) 1 465(57.4) 1 086(42.6) 5 000~ < 10 000 352(5.4) 247(70.2) 105(29.8) 10 000~ < 15 000 1 674(25.5) 1 122(67.0) 552(33.0) 15 000~ < 20 000 713(10.9) 508(71.2) 205(28.8) 20 000~ < 25 000 217(3.3) 157(72.4) 60(27.6) ≥25 000 1 054(16.0) 787(74.7) 267(25.3) 注:①以人数(占比/%)表示。
Note: ① Number of people (proportion/%). 下载: 导出CSV
表 2 性别对衰弱影响的回归结果
Table 2. Regression results for the effect of gender on frailty
回归方程 Regression equation β值 value sx OR值 value(95% CI) P值 value 方程1 Equation 1 因变量:衰弱 Independent variable: frailty 自变量:性别 Dependent variable: gender 0.164 0.034 1.318(1.181~1.470) < 0.001 方程2 Equation 2 因变量:社会经济地位 Independent variable:socioeconomic status 自变量:性别 Dependent variable: gender -1.282 0.071 (-1.417~-1.139) < 0.001 方程3 Equation 3 因变量:衰弱 Independent variable: frailty 自变量:社会经济地位 Dependent variable:socioeconomic status -0.044 0.006 0.928(0.916~0.948) < 0.001 注:方程1和方程3采用logistic回归模型;方程2采用线性回归分析;方程1和方程2,控制年龄、婚姻状况、居住地;方程3调整方程1+SES;OR值通过Probit系数近似转换(公式:OR≈eβ×1.7),与Logit模型结果可比。
Note: Equations 1 and 3 were analyzed using logistic regression models; Equation 2 was analyzed using linear regression; Equations 1 and 2, controlling for age, marriage, and residence; Equation 3 adjusted for equation 1+SES; OR values were converted by Probit coefficient approximation (equation: OR≈eβ×1.7), comparable to Logit model results.
下载: 导出CSV
表 3 社会经济地位在性别与衰弱间的中介效应分析
Table 3. Analysis of the mediating effect of socioeconomic status between gender and frailty
效应
Effectβ值
valuesx 95% Bootstrap CI P值
value效应占比
Effect share/%NDE(性别→衰弱) NDE (gender→frailty) 0.164 0.034 0.095~0.231 < 0.001 74.5 NIE(性别→SES→衰弱) NIE (gender→SES→frailty) 0.056 0.008 0.040~0.073 < 0.001 25.5 注:NDE,直接效应;NIE,间接效应;总效应=NDE+NIE;间接效应占比=间接效应/总效应。
Note: NDE, natural direct effect; NIE, natural indirect effect; Total effect=NDE+NIE; Indirect effect share=indirect effect/total effect.
下载: 导出CSV
-
[1] Cesari M, Prince M, Thiyagarajan JA, et al. Frailty: an emerging public health priority[J]. J Am Med Dir Assoc, 2016, 17(3): 188-192. DOI: 10.1016/j.jamda.2015.12.016. [2] Clegg A, Young J, Iliffe S, et al. Frailty in elderly people[J]. Lancet, 2013, 381(9868): 752-762. DOI: 10.1016/S0140-6736(12)62167-9. [3] Walsh B, Fogg C, England T, et al. Impact of frailty in older people on health care demand: simulation modelling of population dynamics to inform service planning[J]. Health Soc Care Deliv Res. 2024, 12(44): 1-140. DOI: 10.3310/LKJF3976. [4] Wang J, Hulme C. Frailty and socioeconomic status: a systematic review[J]. J Public Health Res, 2021, 10(3): 2036. DOI: 10.4081/jphr.2021.2036. [5] 程慧, 李凌云, 张莉芸, 等. 不同性别老年人衰弱的影响因素分析[J]. 护理研究, 2024, 38(20): 3710-3714. DOI: 10.12102/j.issn.1009-6493.2024.20.027.Cheng H, Li LY, Zhang LY, et al. Analysis of influencing factors of frailty in aged people of different genders[J]. Chinese Nursing Research, 2024, 38(20): 3710-3714. DOI: 10.12102/j.issn.1009-6493.2024.20.027. [6] 高杰, 张晓, 魏超. 不同性别的高龄老年人衰弱的差异研究[J]. 中华老年医学杂志, 2020, 39(11): 1335-1339. DOI: 10.3760/cma.j.issn.0254-9026.2020.11.021.Gao J, Zhang X, Wei C. A study on gender-based differences in frailty in the oldest-old[J]. Chin J Geriat, 2020, 39(11): 1335-1339. DOI: 10.3760/cma.j.issn.0254-9026.2020.11.021. [7] 尹单, 贺惠娟, 李梦盈, 等. 中国老年人中心性肥胖和维生素D水平与衰弱的关系研究[J]. 中国全科医学, 2025, 28(8): 933-938.Yin D, He HJ, Li MY, et al. Association between abdominal obesity, vitamin D levels and frailty in Chinese elder adults[J]. Chin Gen Pract, 2025, 28(8): 933-938. [8] Shi J, Tao Y, Meng L, et al. Frailty status among the elderly of different genders and the death risk: a follow-up study[J]. Front Med. 2021, 8: 715659. DOI: 10.3389/fmed.2021.715659. [9] Zhang J, Xu LZ, Sun L, et al. Gender difference in the association of frailty and health care utilization among Chinese older adults: results from a population-based study[J]. Aging Clin Exp Res, 2020, 32(10): 1985-1991. DOI: 10.1007/s40520-019-01410-4. [10] Wei X, Li C, Liu D, et al. Profile of non-invasive physical health indicators associated with cognitive performance in Chinese older adults: evidence from the China Health and Retirement Longitudinal Study[J]. BMC Public Health. 2025, 25(1): 420. DOI: 10.1186/s12889-025-21479-z. [11] Hoogendijk EO, Muntinga ME, Breij SD, et al. Inequalities in frailty among older turkish and moroccan immigrants and native dutch: data from the longitudinal aging study amsterdam[J]. J Immigr Minor Health. 2022, 24(2): 385-393. DOI: 10.1007/s10903-021-01169-9. [12] Fan JN, Yu CQ, Guo Y, et al. Frailty index and all-cause and cause-specific mortality in Chinese adults: a prospective cohort study[J]. Lancet Public Health, 2020, 5(12): e650-e660. DOI: 10.1016/S2468-2667(20)30113-4. [13] Luo T, Lin SR, Zhang WY, et al. Relationship between socioeconomic status and hypertension incidence among adults in southwest China: a population-based cohort study[J]. BMC Public Health, 2024, 24(1): 1211. DOI: 10.1186/s12889-024-18686-5. [14] 周全湘, 佘福强, 杨敬源, 等. 贵州黔南民族地区农村60岁以上老年人衰弱现况及影响因素[J]. 中华疾病控制杂志, 2020, 24(10): 1139-1143. DOI: 10.16462/j.cnki.zhjbkz.2020.10.006.Zhou QX, She FQ, Yang JY, et al. Investigate frailty status and analysis its influencing factors of the elderly in Qiannan rural minority arears of Guizhou[J]. Chin J Dis Control Prev, 2020, 24(10): 1139-1143. DOI: 10.16462/j.cnki.zhjbkz.2020.10.006. [15] 汪慧, 陈玉洁, 丁宏, 等. 安徽省长丰县农村老年人衰弱现状及其影响因素[J]. 医学与社会, 2025, 38(2): 67-73. DOI: 10.13723/j.yxysh.2025.02.010.Wang H, Chen YJ, Ding H, et al. Current situation and influencing factors of frailty among older adults in rural area in Changfeng county of Anhui Province[J]. Medicine and Society, 2025, 38(2): 67-73. DOI: 10.13723/j.yxysh.2025.02.010. [16] Xu WW, Cai JS, Liu YC, et al. Sarcopenia and frailty among older Chinese adults: findings from the CHARLS study[J]. PLoS One, 2024, 19(11): e0312879. DOI: 10.1371/journal.pone.0312879. [17] Gordon SJ, Baker N, Kidd M, et al. Pre-frailty factors in community-dwelling 40-75 year olds: opportunities for successful ageing[J]. BMC Geriatr, 2020, 20(1): 96. DOI: 10.1186/s12877-020-1490-7. [18] 万莹, 申雪花. 老年患者衰弱评估的研究进展[J]. 中国老年学杂志, 2024, 44(17): 4349-4351. DOI: 10.3969/j.issn.1005-9202.2024.17.056.Wan Y, Shen XH. Advances in the assessment of frailty in elderly patients[J]. Chinese Journal of Gerontology, 2024, 44(17): 4349-4351. DOI: 10.3969/j.issn.1005-9202.2024.17.056. [19] 夏玮涛, 吴佳其, 阙家雯, 等. 浙江省城乡老年人衰弱比较[J]. 护理学杂志, 2023, 38(12): 111-116. DOI: 10.3870/j.issn.1001-4152.2023.12.111.Xia WT, Wu JQ, Que JW, et al. Comparison of frailty among urban and rural older adults in Zhejiang Province[J]. Journal of Nursing Science, 2023, 38(12): 111-116. DOI: 10.3870/j.issn.1001-4152.2023.12.111. [20] Li J. Gender Discrimination Against Women in Chinese Workplace[J]. J Educ Humanit Soc Sci, 2024, 45: 712-717. DOI: 10.54097/zvpht295. -

 点击查看大图
计量
- 文章访问数: 0
- HTML全文浏览量: 1
- PDF下载量: 0
- 被引次数: 0